Adg Editorial Edition
Ten years. Five signals.

Editorial content. This page contains the full editorial reading. Social media cards are separate promotional assets, shown in their own section.

Read the edition

Series · Publication day · Credits and sources

Highest inflation in the region

The development: Highest inflation in the region: Nigeria 23.0% (2025).

What the evidence says: One figure, one country, one year. Source: World Bank WDI.

Question to watch: Which of these gaps matters most for your country?

GDP growth 2025

The development: GDP growth 2025: where does your country sit?

What the evidence says: Five classed ranges, with the number of countries in each. Lowest Nigeria 4.0% · highest Benin 8.1%.

Question to watch: Which of these gaps matters most for your country?

Inflation 2025

The development: Inflation 2025: where does your country sit?

What the evidence says: Five classed ranges, with the number of countries in each. Lowest Niger -4.5% · highest Nigeria 23.0%.

Question to watch: Which of these gaps matters most for your country?

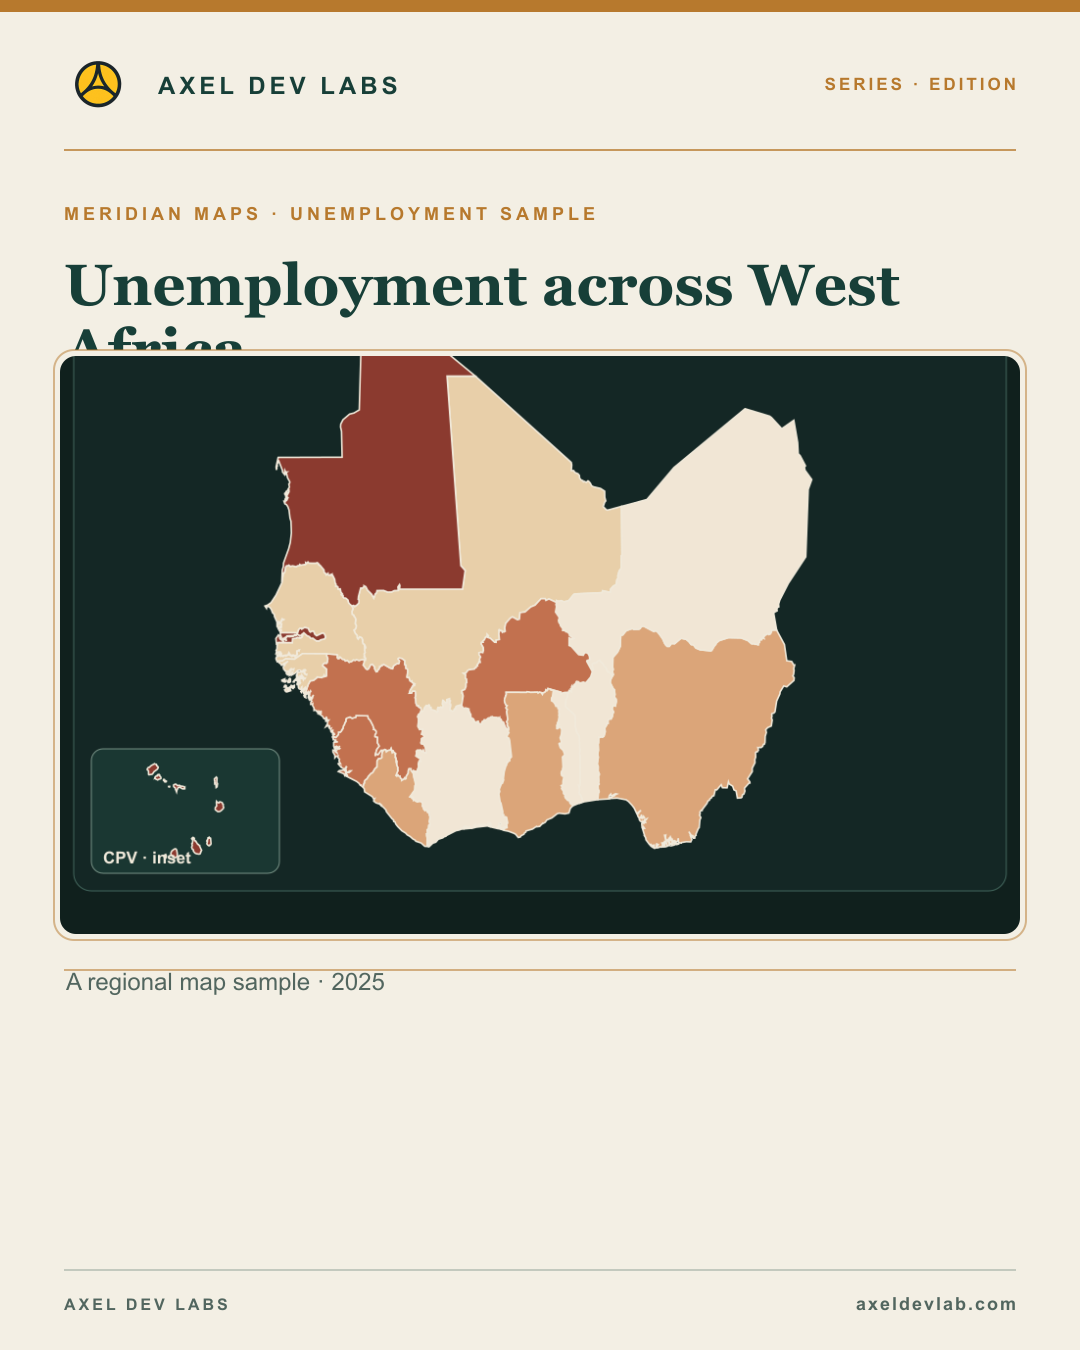
Unemployment 2025

The development: Unemployment 2025: where does your country sit?

What the evidence says: Five classed ranges, with the number of countries in each. Lowest Niger 0.4% · highest Cabo Verde 11.9%.

Question to watch: Which of these gaps matters most for your country?

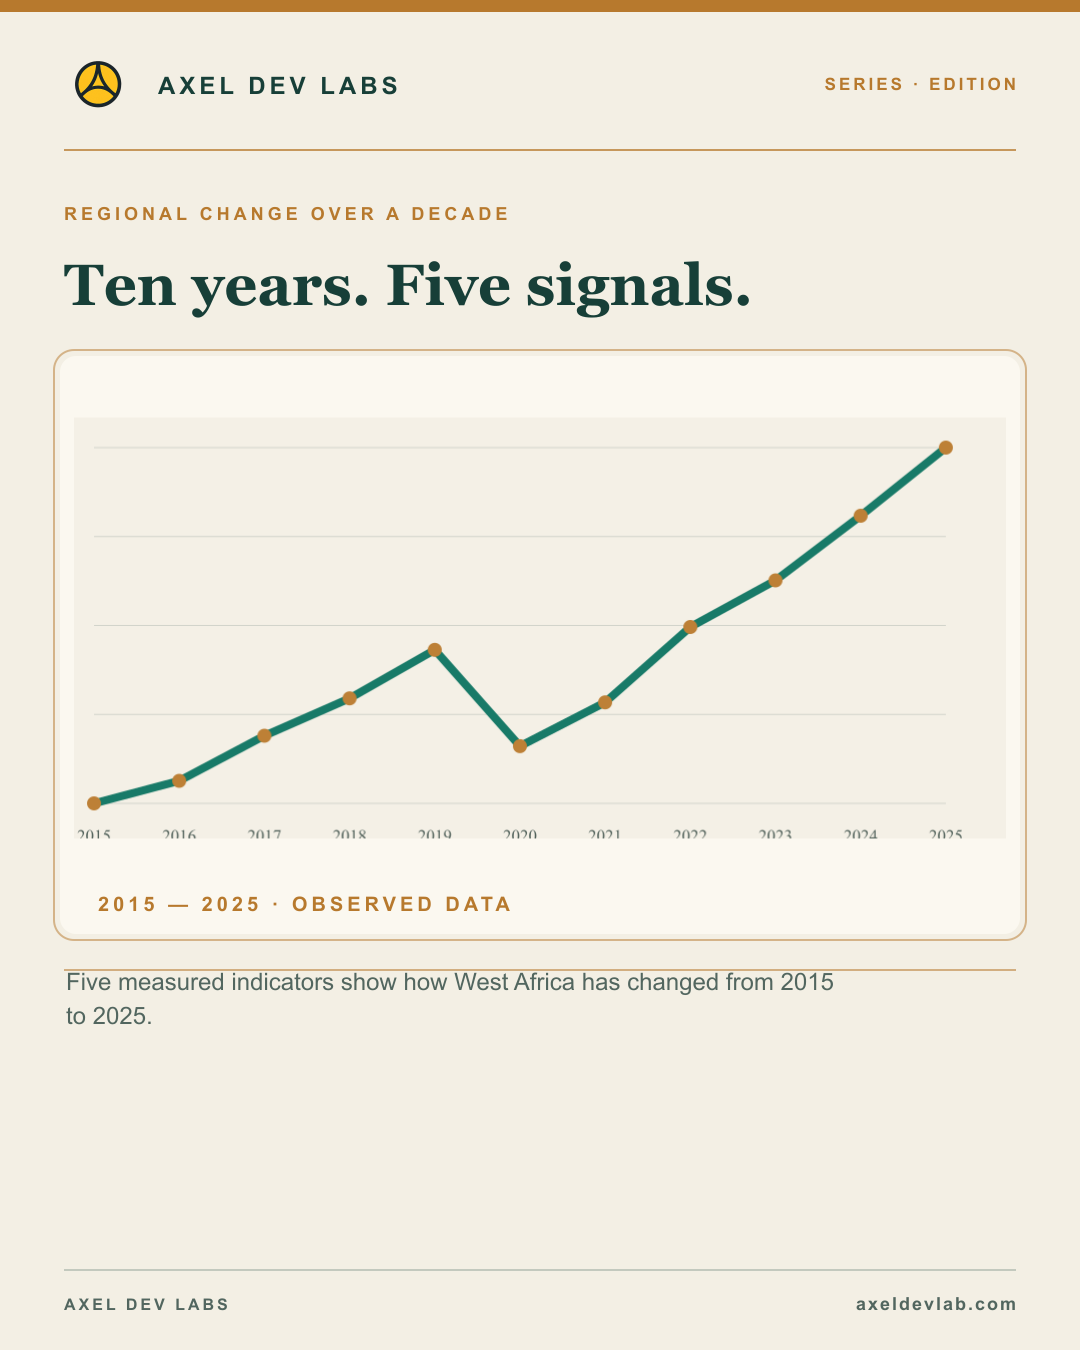
GDP per person: ten years of change

The development: 2015–2025: annual regional mean.

What the evidence says: Annual unweighted national mean · constant 2015 US$ · 16 countries. The country count in each year is recorded in the edition data.

Real GDP growth: ten years of change

The development: 2015–2025: annual regional mean.

What the evidence says: Annual unweighted national mean · annual % · 16 countries. The country count in each year is recorded in the edition data.

Unemployment: ten years of change

The development: 2015–2025: annual regional mean.

What the evidence says: Annual unweighted national mean · % of labour force · 16 countries. The country count in each year is recorded in the edition data.

Consumer price inflation: ten years of change

The development: 2015–2025: annual regional mean.

What the evidence says: Annual unweighted national mean · annual % · 16 countries. The country count in each year is recorded in the edition data.

Access to electricity: ten years of change

The development: 2015–2024: annual regional mean.

What the evidence says: Annual unweighted national mean · % of population · 16 countries. The country count in each year is recorded in the edition data.

Social media cards · separate promotional assets

Each link opens a social-ready card image, its platform caption and permanent post URL. These assets do not replace the editorial content above.

Adg Editorial Edition
Where electricity reaches

Editorial content. This page contains the full editorial reading. Social media cards are separate promotional assets, shown in their own section.

Read the edition

Series · Publication day · Credits and sources

Lowest electricity access

The development: Lowest electricity access: Niger 21% (2024).

What the evidence says: One figure, one country, one year. Source: World Bank WDI.

Question to watch: Which of these gaps matters most for your country?

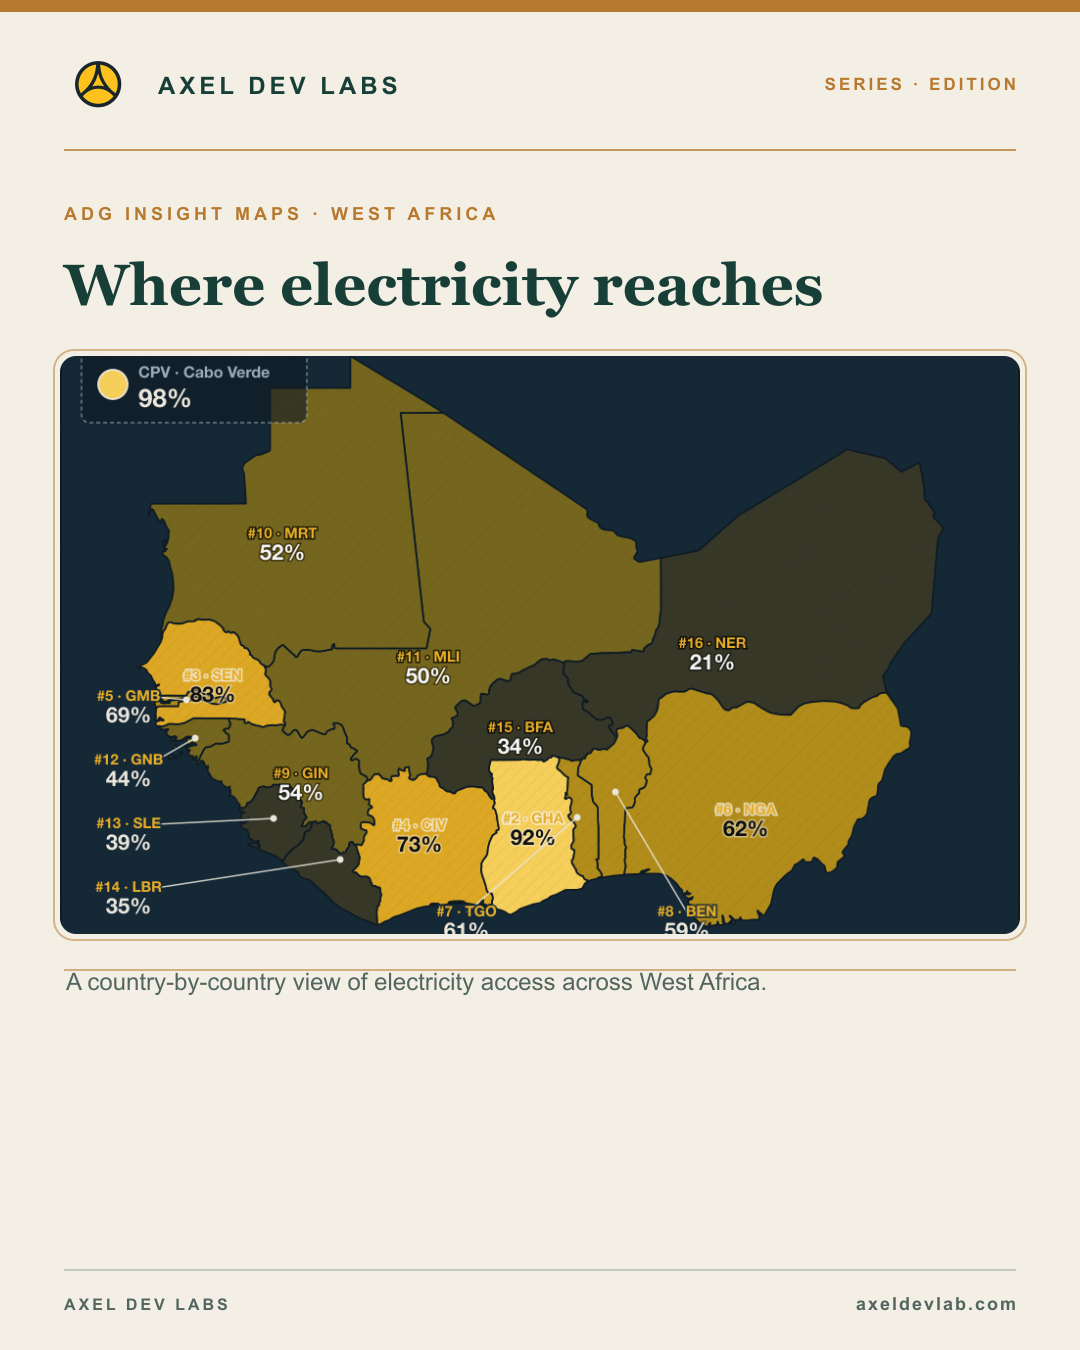
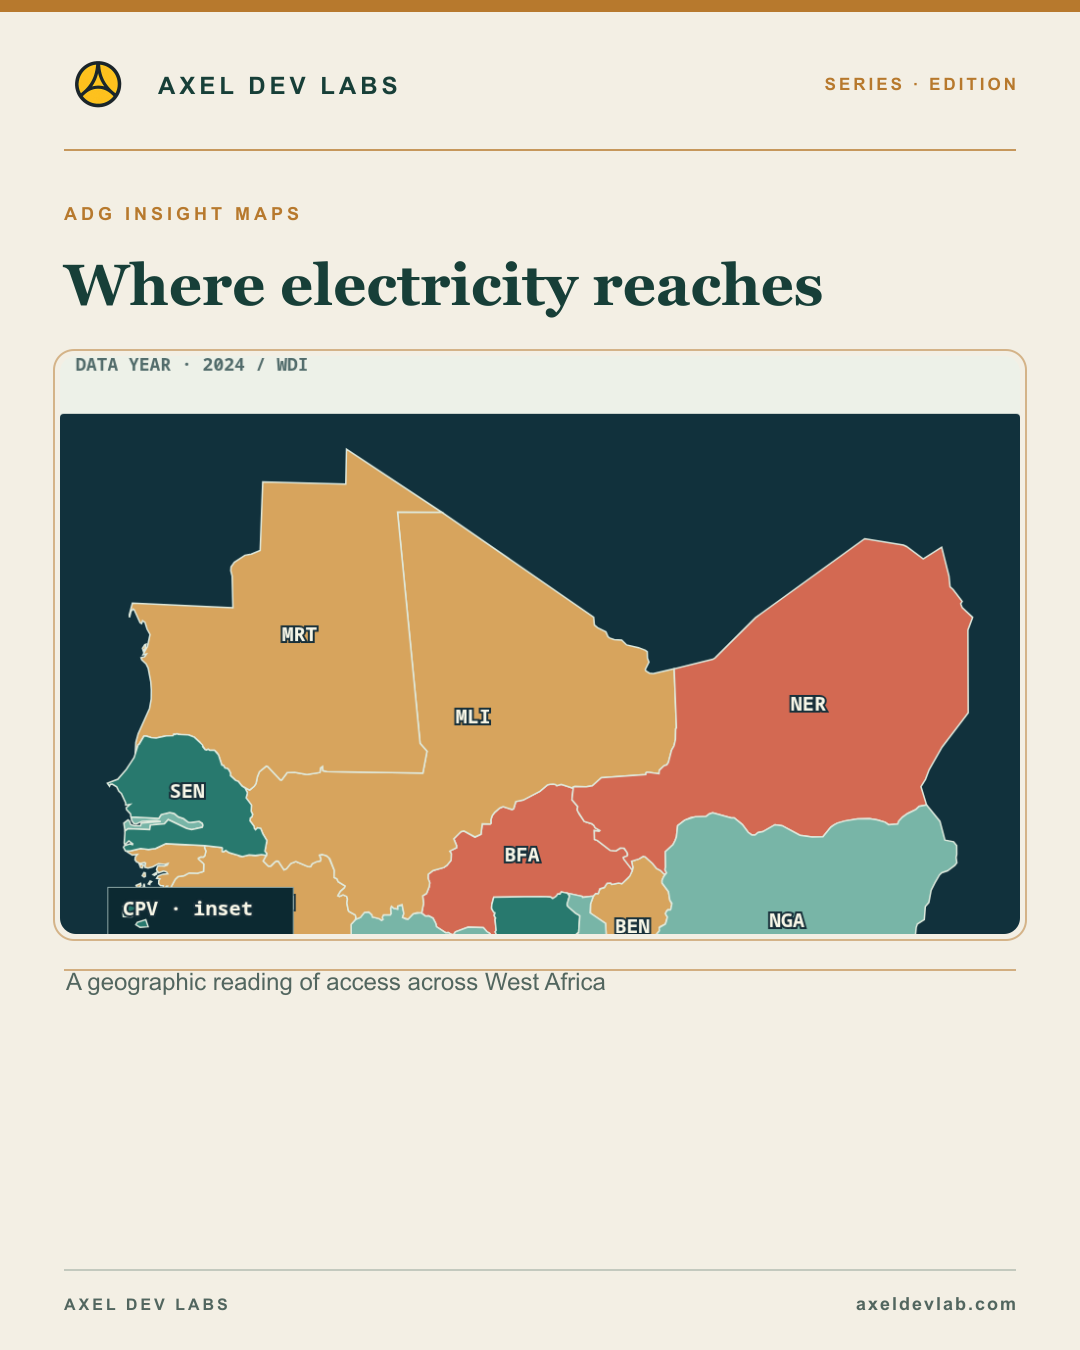
Access to electricity 2024

The development: Access to electricity 2024: where does your country sit?

What the evidence says: Five classed ranges, with the number of countries in each. Lowest Niger 21% · highest Cabo Verde 98%.

Question to watch: Which of these gaps matters most for your country?

Social media cards · separate promotional assets

Each link opens a social-ready card image, its platform caption and permanent post URL. These assets do not replace the editorial content above.

Adg Editorial Edition
GDP per capita · 2025

Editorial content. This page contains the full editorial reading. Social media cards are separate promotional assets, shown in their own section.

Read the edition

Series · Publication day · Credits and sources

The distribution

The development: Sixteen countries; the median is $1,304 and the mean is $1,833.

What the evidence says: Flags identify countries; orange marks above the regional mean and teal marks below it.

Question to watch: Which countries set the range?

Social media cards · separate promotional assets

Each link opens a social-ready card image, its platform caption and permanent post URL. These assets do not replace the editorial content above.

Adg Editorial Edition
West Africa GDP per capita · 2025

Editorial content. This page contains the full editorial reading. Social media cards are separate promotional assets, shown in their own section.

Read the edition

Series · Publication day · Credits and sources

How countries compare with the regional mean

The development: current US$ · 2025 · Fixed class edges, so years can be compared directly.

What the evidence says: The median and mean answer different questions.

Question to watch: Why do the mean and median differ here?

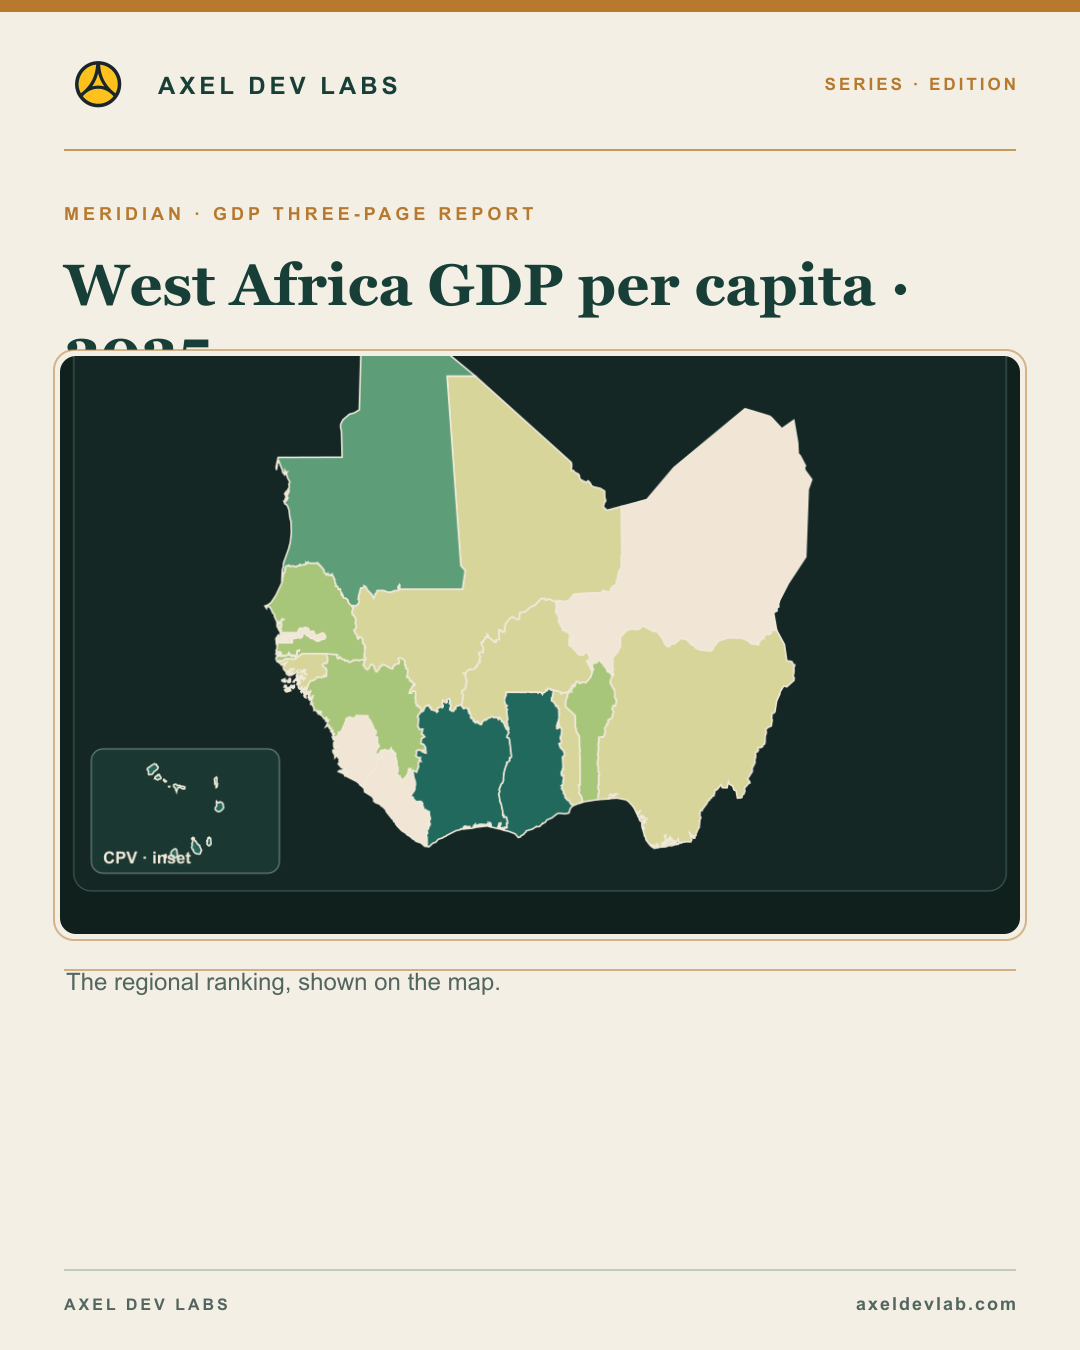
Reading the GDP per capita map

The development: A national average cannot show income distribution within a country.

What the evidence says: Values are current US dollars per person for 2025. Fixed class edges support comparison across years; they do not measure household income or purchasing power.

Question to watch: Which country would you examine first?

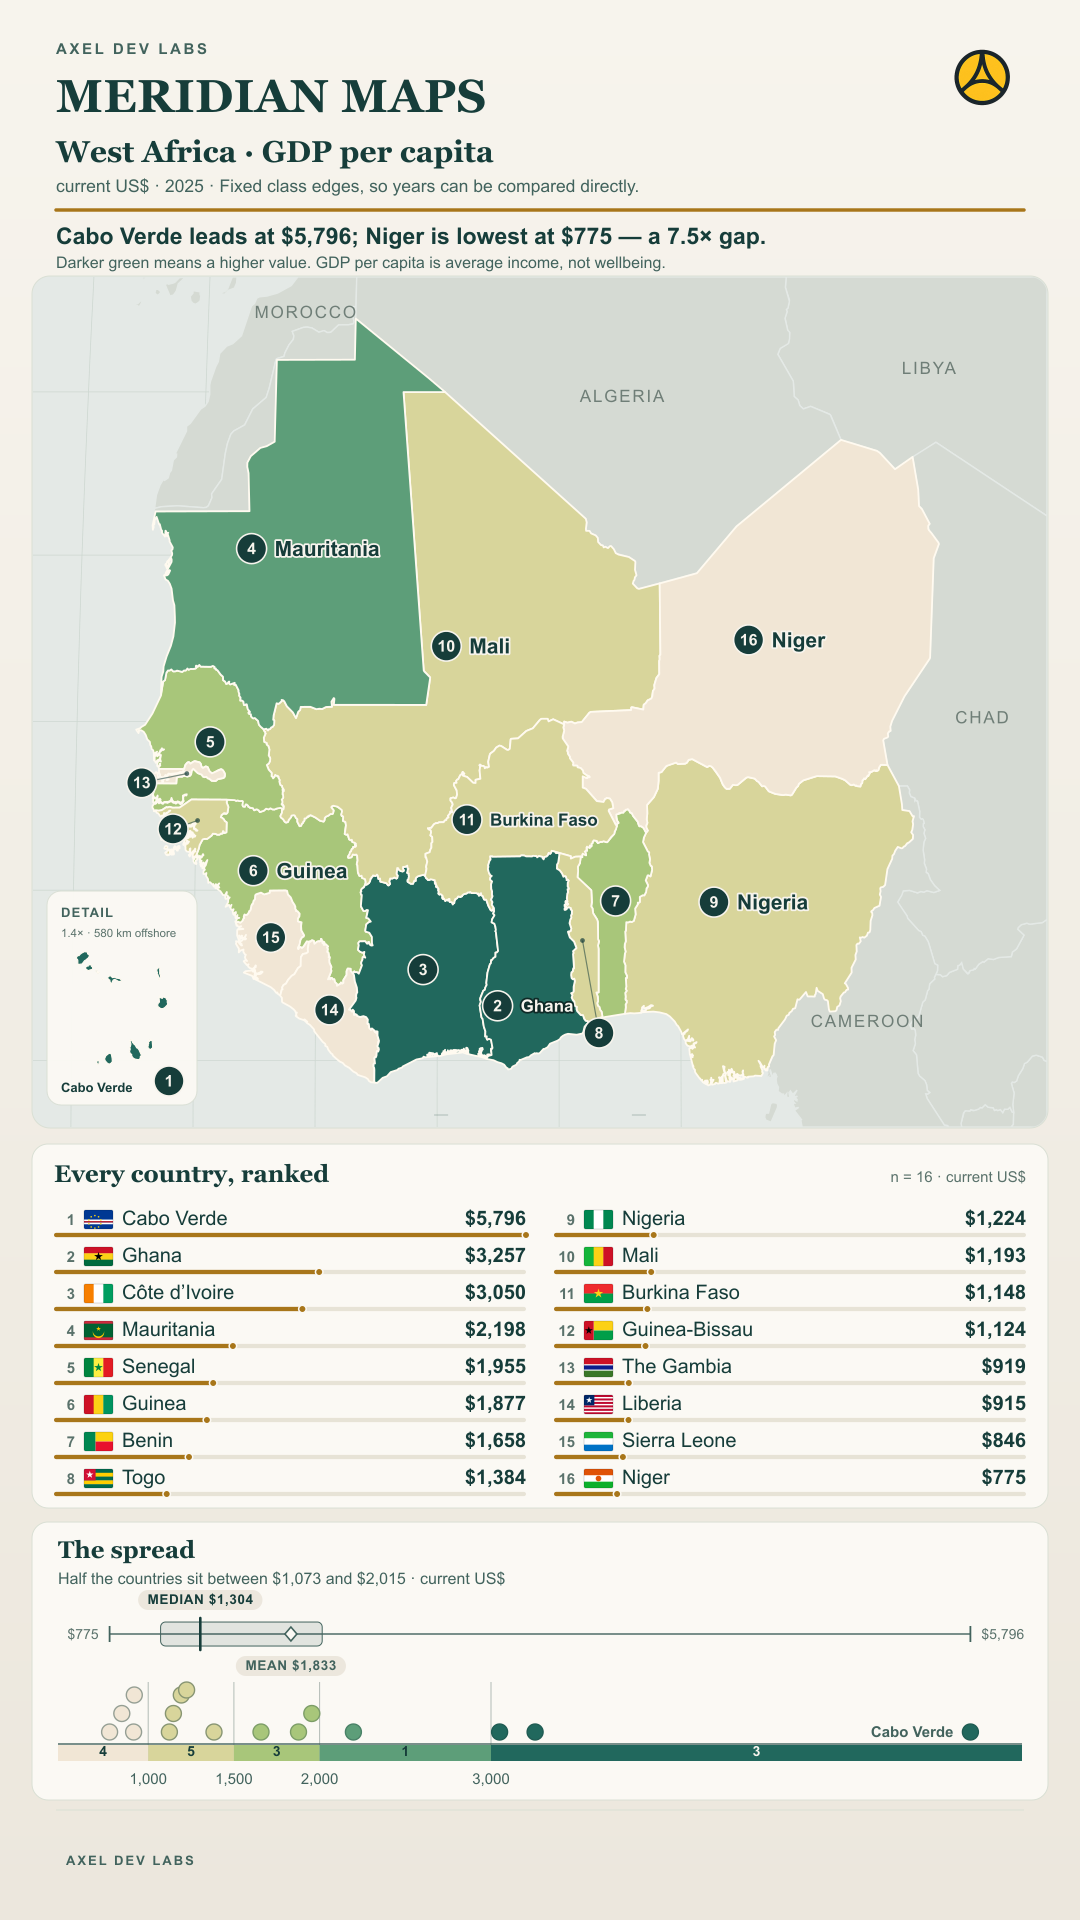
GDP per capita

The development: current US$ · 2025 · Fixed class edges, so years can be compared directly.

What the evidence says: Cabo Verde leads at $5,796; Niger is lowest at $775 — a 7.5× gap.

Question to watch: Which contrast on the map deserves an explanation?

What GDP per capita leaves out

The development: current US$ · 2025 · Fixed class edges, so years can be compared directly.

What the evidence says: The 16-country mean is not population-weighted.

Question to watch: What does this comparison leave out?

Social media cards · separate promotional assets

Each link opens a social-ready card image, its platform caption and permanent post URL. These assets do not replace the editorial content above.

Adg Editorial Edition
Unemployment across West Africa

Editorial content. This page contains the full editorial reading. Social media cards are separate promotional assets, shown in their own section.

Read the edition

Series · Publication day · Credits and sources

Unemployment by country · 2025

The development: Equal-count classes make relative positions easier to compare.

What the evidence says: National estimate; not a measure of job quality or informal employment.

Social media cards · separate promotional assets

Each link opens a social-ready card image, its platform caption and permanent post URL. These assets do not replace the editorial content above.

Adg Editorial Edition
Where electricity reaches

Editorial content. This page contains the full editorial reading. Social media cards are separate promotional assets, shown in their own section.

Read the edition

Series · Publication day · Credits and sources

Electricity access varies.

The development: 16 / 16 countries · 2024

What the evidence says: Color encodes access rate, not policy success or cause.

Question to watch: Which countries share an access band?

Electricity access: two extremes.

The development: Niger 21.3% · Cabo Verde 98.4%

What the evidence says: 77.1 percentage-point range · 2024

Question to watch: What might explain the range without assuming a cause?

A national rate is not a local map.

The development: This figure describes the share of people with electricity access nationally. It cannot show which neighborhood or household is left out.

What the evidence says: Color encodes access rate, not policy success or cause.

Question to watch: What local evidence would test this national pattern?

Social media cards · separate promotional assets

Each link opens a social-ready card image, its platform caption and permanent post URL. These assets do not replace the editorial content above.

No results found

Try adjusting your search or filters.