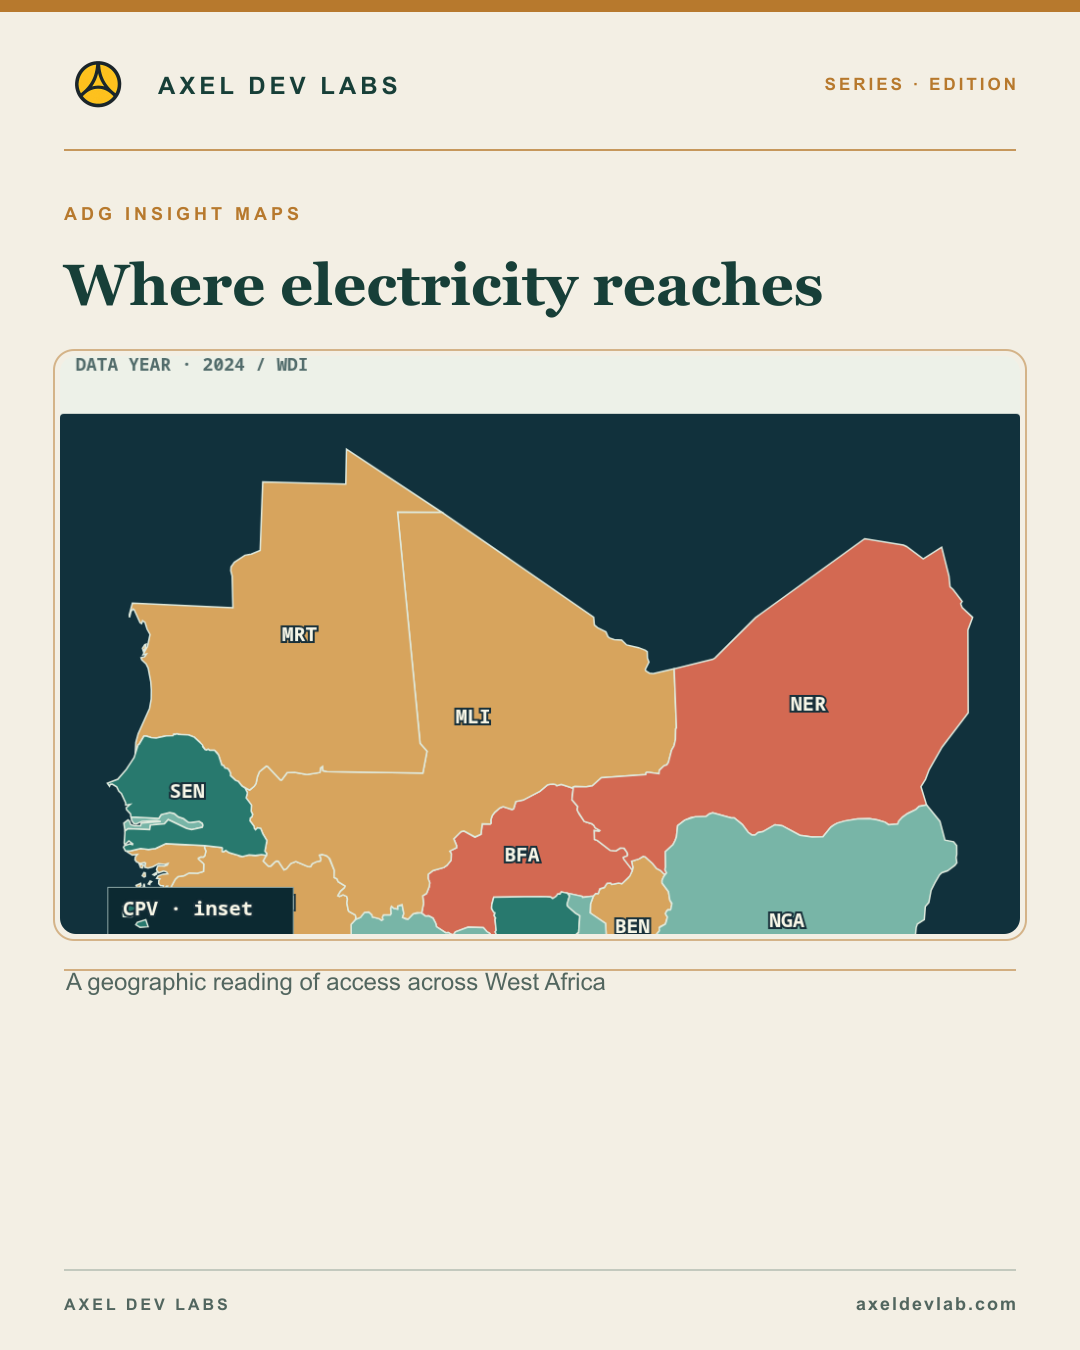
Five ten-year evolution charts for GDP per person, real GDP growth, unemployment, consumer-price inflation and electricity access, with supporting maps, evidence and a separate credits page. Each chart preserves its source, coverage and limitations.
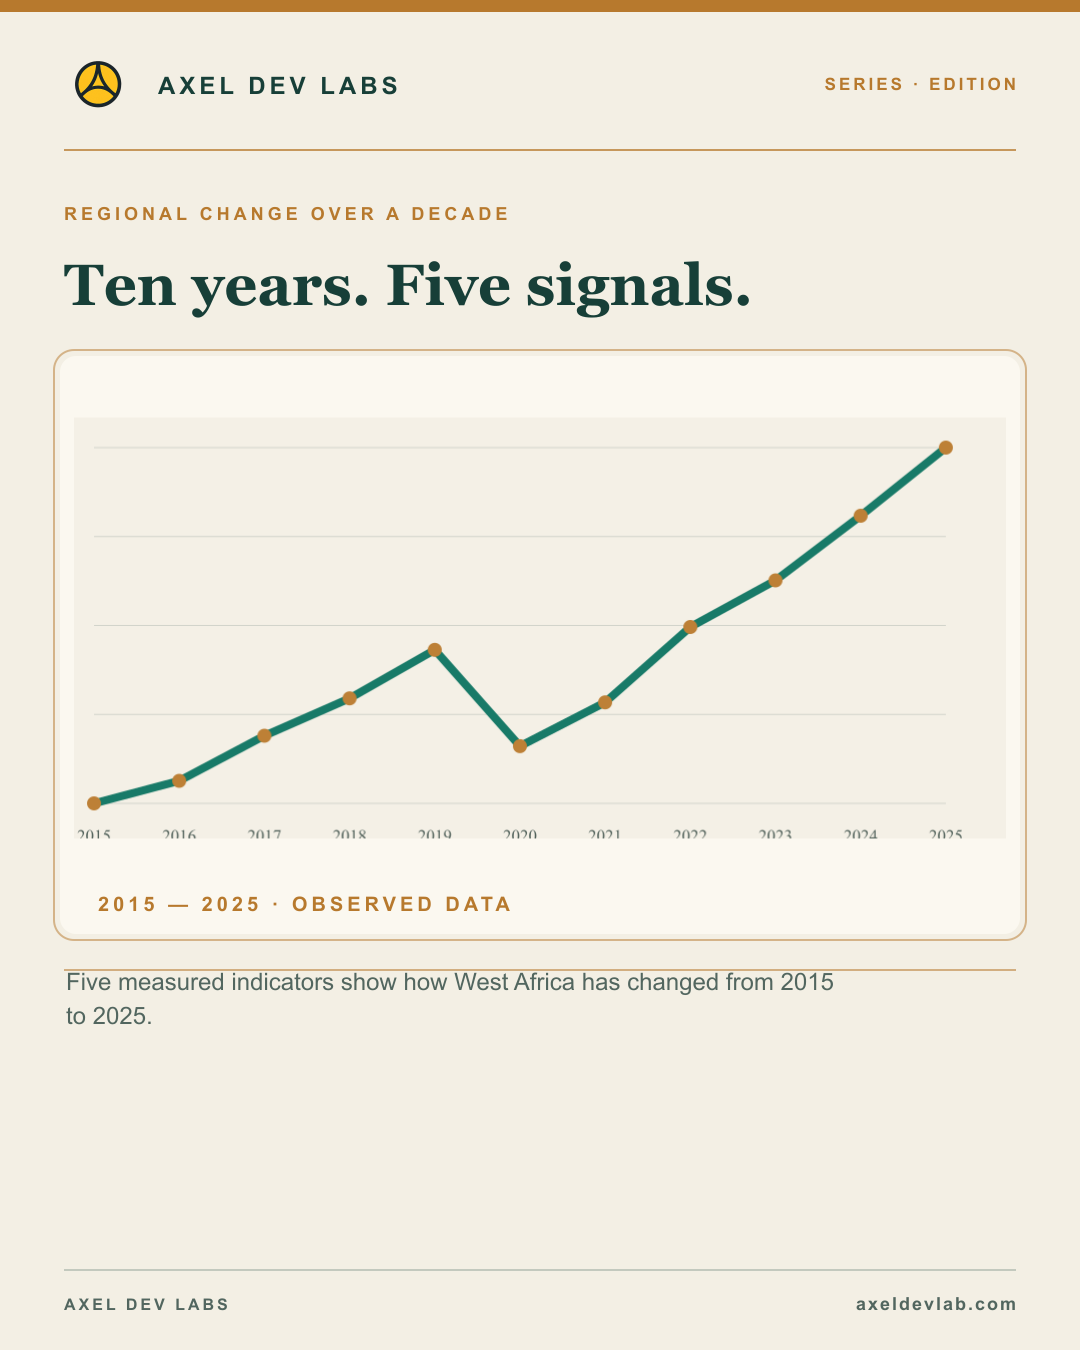
Editorial content. This page contains the full editorial reading. Social media cards are separate promotional assets, shown in their own section.
Read the edition
Series · Publication day · Credits and sourcesHighest inflation in the region
The development: Highest inflation in the region: Nigeria 23.0% (2025).
What the evidence says: One figure, one country, one year. Source: World Bank WDI.
Question to watch: Which of these gaps matters most for your country?
GDP growth 2025
The development: GDP growth 2025: where does your country sit?
What the evidence says: Five classed ranges, with the number of countries in each. Lowest Nigeria 4.0% · highest Benin 8.1%.
Question to watch: Which of these gaps matters most for your country?
Inflation 2025
The development: Inflation 2025: where does your country sit?
What the evidence says: Five classed ranges, with the number of countries in each. Lowest Niger -4.5% · highest Nigeria 23.0%.
Question to watch: Which of these gaps matters most for your country?
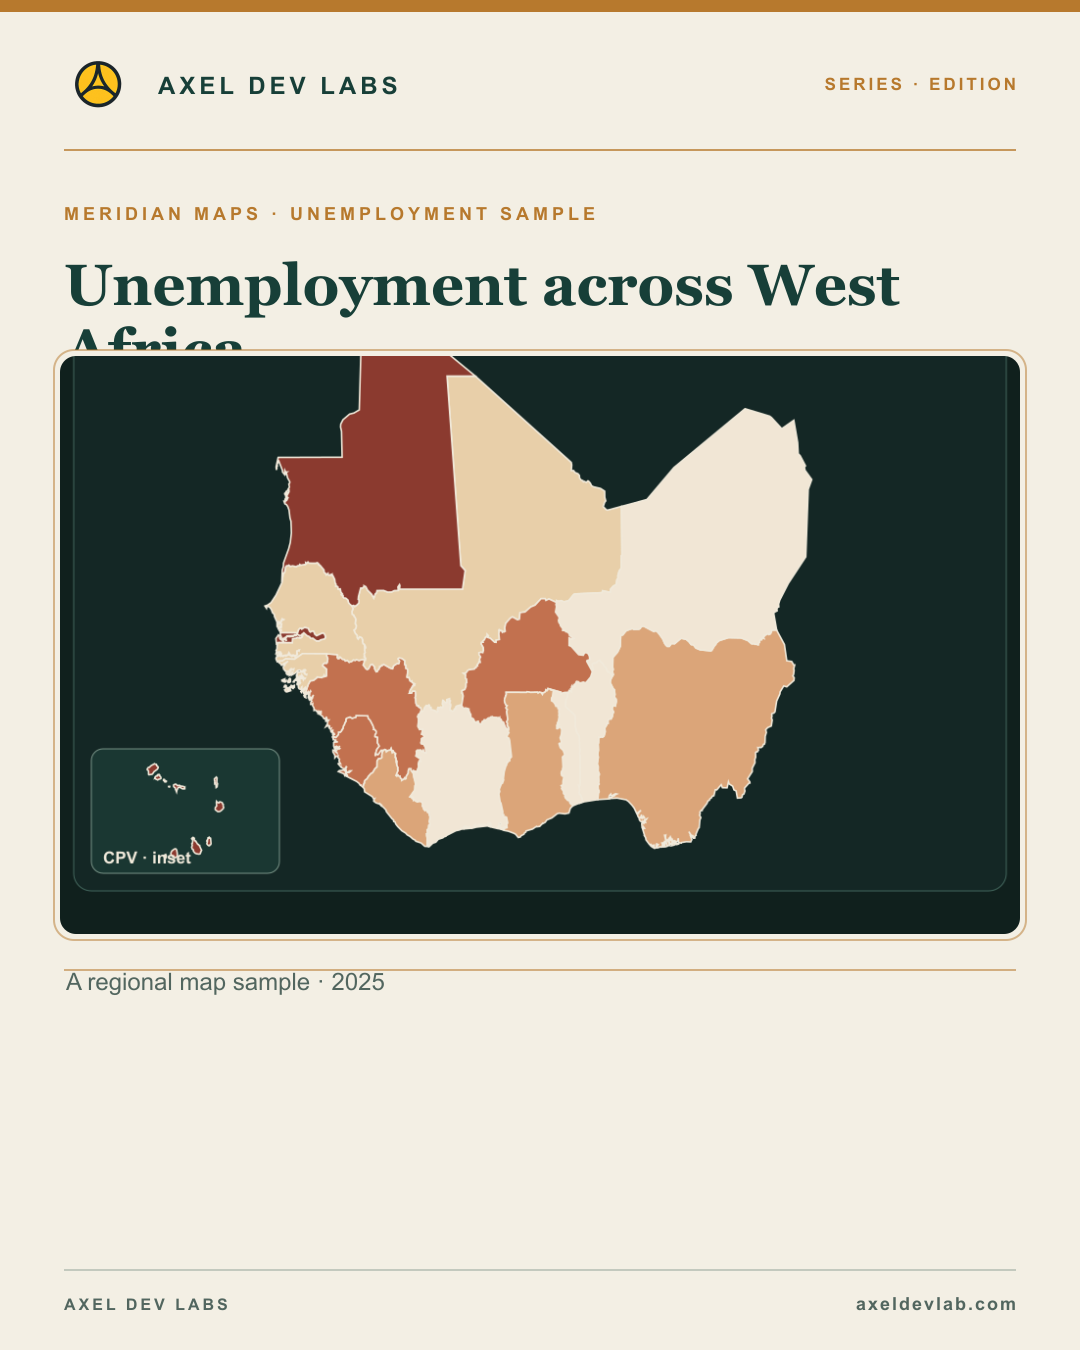
Unemployment 2025
The development: Unemployment 2025: where does your country sit?
What the evidence says: Five classed ranges, with the number of countries in each. Lowest Niger 0.4% · highest Cabo Verde 11.9%.
Question to watch: Which of these gaps matters most for your country?
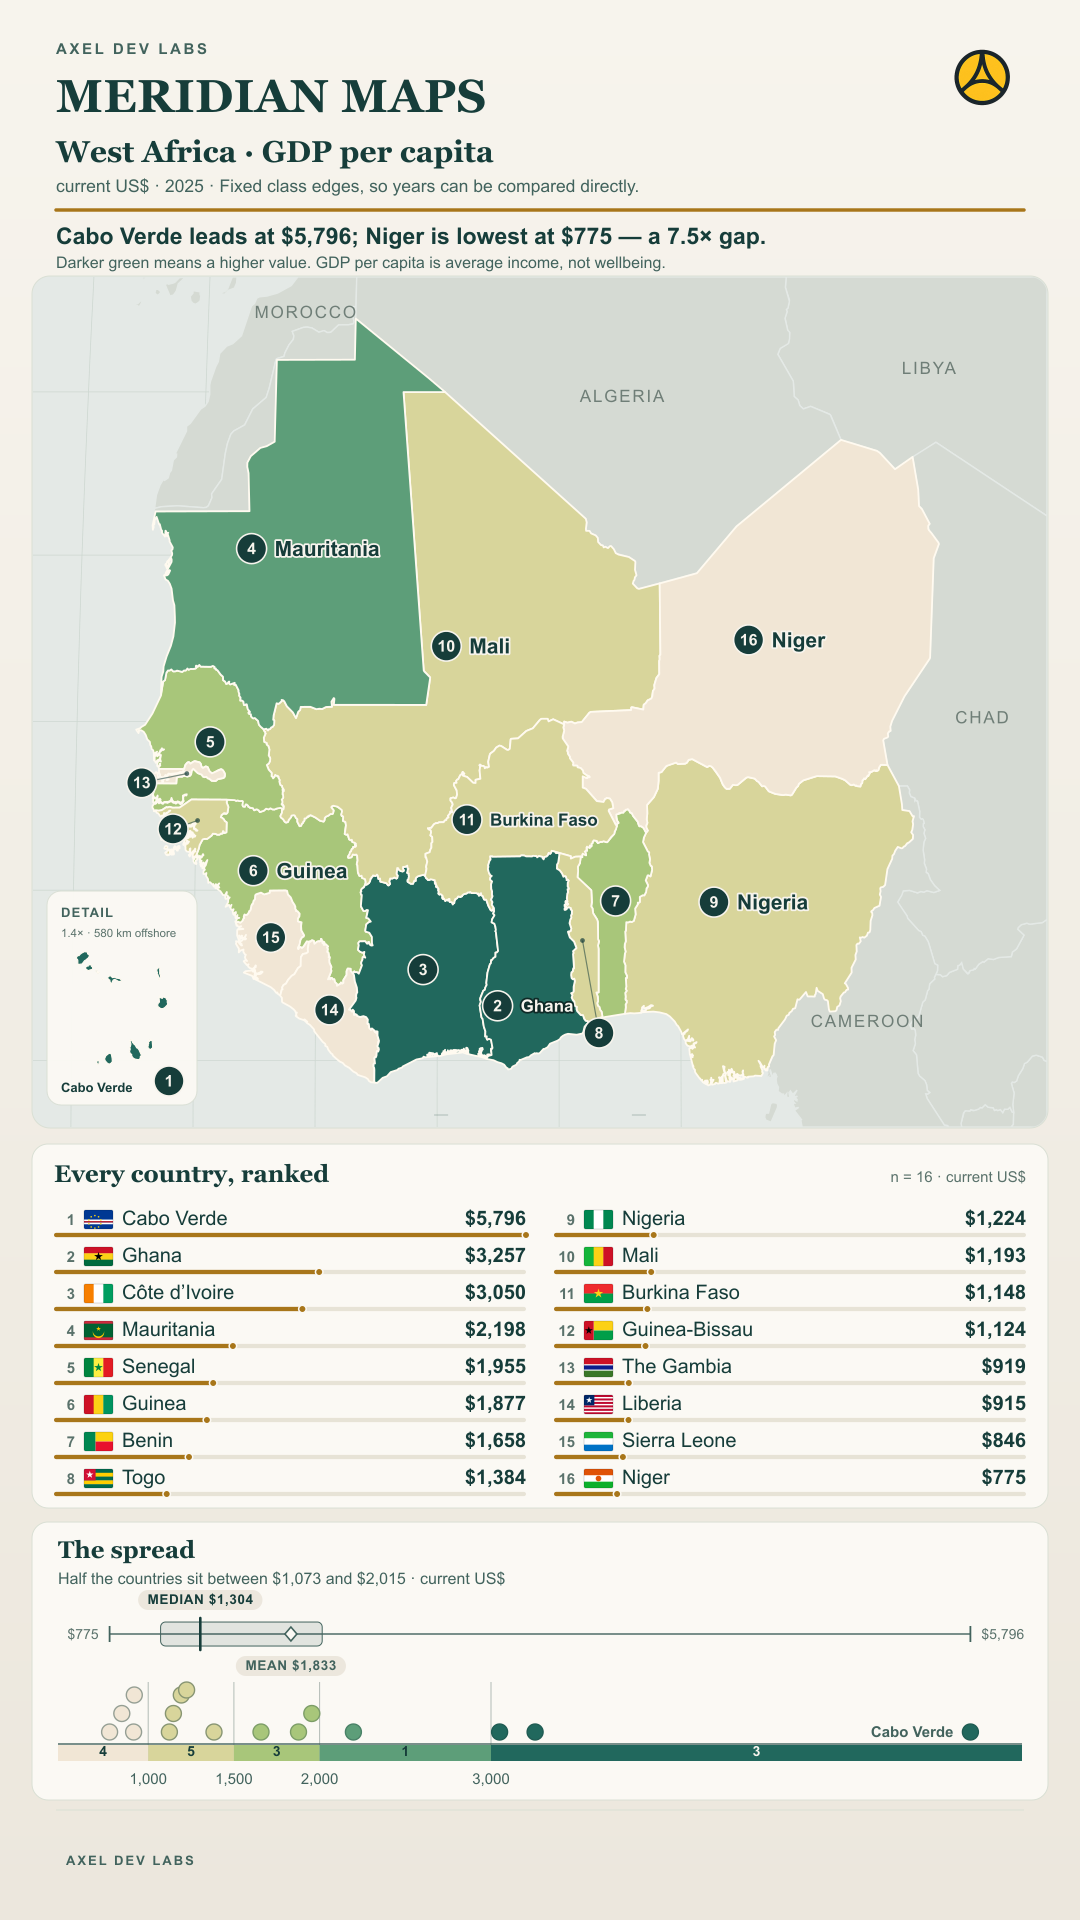
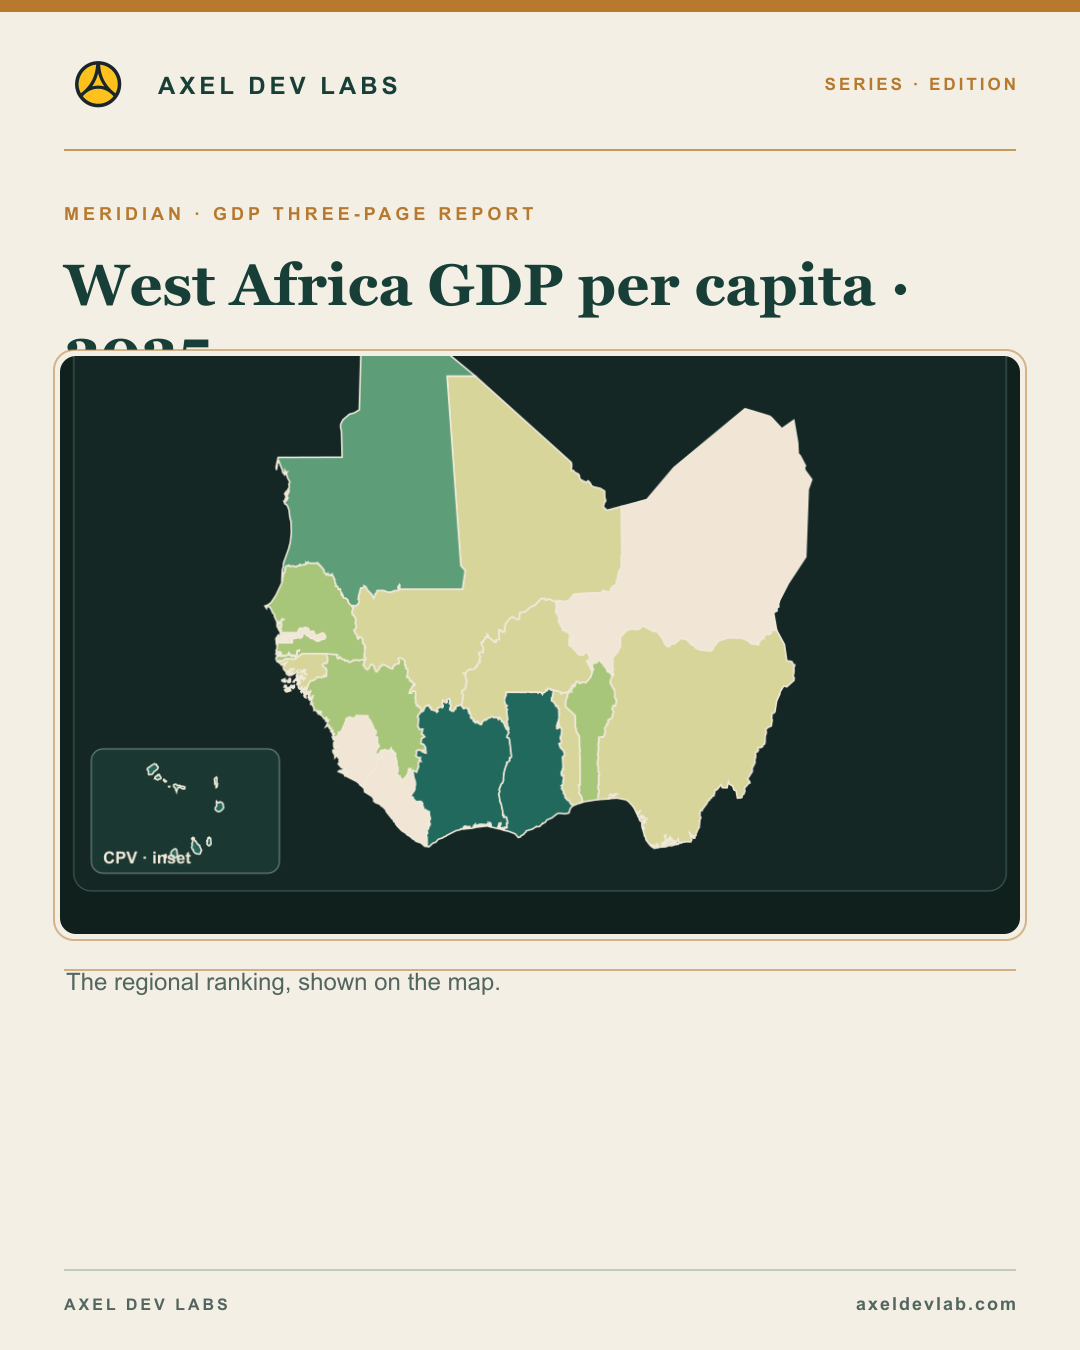
GDP per person: ten years of change
The development: 2015–2025: annual regional mean.
What the evidence says: Annual unweighted national mean · constant 2015 US$ · 16 countries. The country count in each year is recorded in the edition data.
Real GDP growth: ten years of change
The development: 2015–2025: annual regional mean.
What the evidence says: Annual unweighted national mean · annual % · 16 countries. The country count in each year is recorded in the edition data.
Unemployment: ten years of change
The development: 2015–2025: annual regional mean.
What the evidence says: Annual unweighted national mean · % of labour force · 16 countries. The country count in each year is recorded in the edition data.
Consumer price inflation: ten years of change
The development: 2015–2025: annual regional mean.
What the evidence says: Annual unweighted national mean · annual % · 16 countries. The country count in each year is recorded in the edition data.
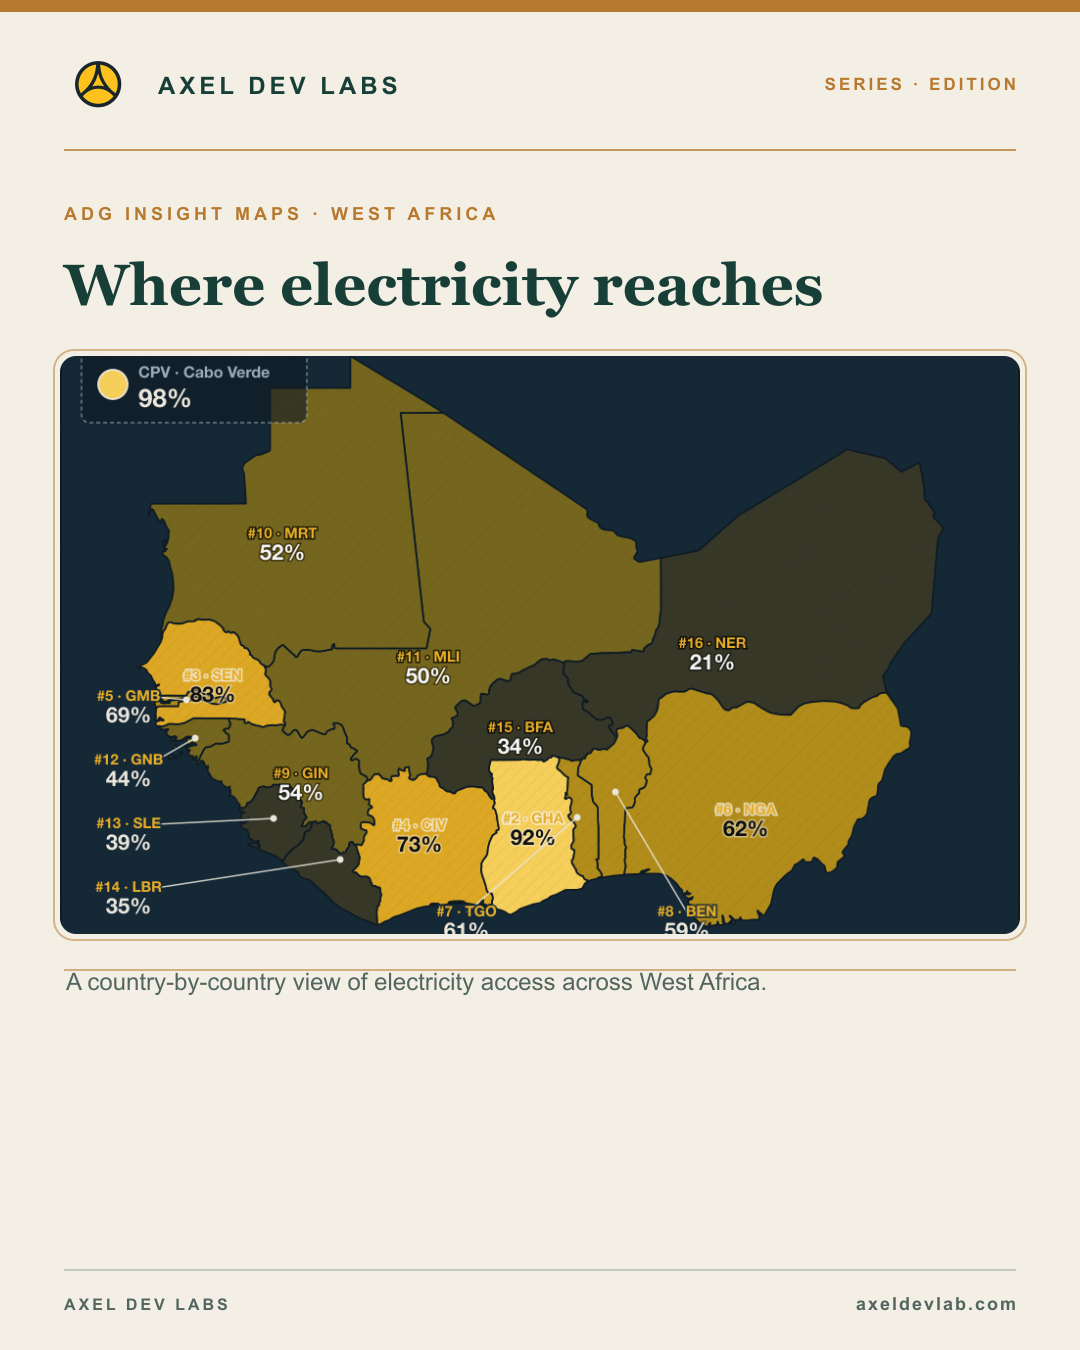
Access to electricity: ten years of change
The development: 2015–2024: annual regional mean.
What the evidence says: Annual unweighted national mean · % of population · 16 countries. The country count in each year is recorded in the edition data.
Social media cards · separate promotional assets
Each link opens a social-ready card image, its platform caption and permanent post URL. These assets do not replace the editorial content above.
- Meridian Maps · Ten-year regional trends · Highest inflation in the region
- Access to electricity: ten years of change
- Consumer price inflation: ten years of change
- Real GDP growth: ten years of change
- GDP per person: ten years of change
- Unemployment: ten years of change
- Highest inflation in the region
- GDP growth 2025
- Inflation 2025
- Unemployment 2025