
Adg Production Batch
Adg Production Batch
Data, Explained · short-form data explainers; TikTok is the distribution channel, not the series name.
Oct 16, 2026 1 min read
ADG production taxonomy
Adg Credit Record
Editorial direction, concept and publication: Jean-Axel Désiré Tohougbé · ADG Lab.Series · Production batch · Read the full edition · Publication dayQR code and link to this publication batchhttps://library.axeldevlab.com/library/batches...
Oct 16, 2026 1 min read

Editorial direction, concept and publication: Jean-Axel Désiré Tohougbé · ADG Lab.
Series · Production batch · Read the full edition · Publication day
QR code and link to this publication batch
https://library.axeldevlab.com/library/batches/inflation-west-africa/2026-10-15/en
Permanent link to this credit page
Cards in this edition
- Inflation · Data Brief · Consumer price inflation
- Consumer price inflation · regional finding
- Consumer price inflation · 2025
Visual asset credits
- Consumer price inflation · regional finding — Original ADG data card artwork; the underlying indicator is credited on the separate edition credits page.
- Consumer price inflation · 2025 — Country boundaries: Natural Earth; flags: national flag artwork; map generated by Axel Dev Lab. Full data and geographic credits are listed on the edition credits page.
- Inflation across West Africa — Original ADG map-led cover using the series map; detailed data and asset sources are on the separate credit page.
Editorial references
- World Development Indicators · FP.CPI.TOTL.ZG · 2025
ADG production taxonomy
Adg Credit Record
Editorial direction, concept and publication: Jean-Axel Désiré Tohougbé · ADG Lab.Series · Production batch · Read the full edition · Publication dayQR code and link to this publication batchhttps://library.axeldevlab.com/library/batches...
Oct 16, 2026 1 min read

Editorial direction, concept and publication: Jean-Axel Désiré Tohougbé · ADG Lab.
Series · Production batch · Read the full edition · Publication day
QR code and link to this publication batch
https://library.axeldevlab.com/library/batches/tiktok-agent/2026-10-15/en
Permanent link to this credit page
Cards in this edition
- 2025 inflation in West Africa: Nigeria at 23%, Niger at -4.5%
- Consumer price inflation · 2025
- Why it matters
- Which local conditions would help explain this gap without mistaking correlation for cause?
Visual asset credits
- 2025 inflation in West Africa: Nigeria at 23%, Niger at -4.5% — Felloh Jaloo · CC BY 4.0 · Check source and rights
- Consumer price inflation · 2025 — Felloh Jaloo · CC BY 4.0 · Check source and rights
- Why it matters — Felloh Jaloo · CC BY 4.0 · Check source and rights
- Which local conditions would help explain this gap without mistaking correlation for cause? — Felloh Jaloo · CC BY 4.0 · Check source and rights

Editorial references
- World Development Indicators · FP.CPI.TOTL.ZG
ADG production taxonomy
Adg Social Post
Social media card · promotional assetThis image and caption are short-form social distribution assets. They are separate from the full editorial content and do not replace it.Consumer price inflation · 2025Compare available West African ...
Oct 16, 2026 1 min read
Social media card · promotional asset
This image and caption are short-form social distribution assets. They are separate from the full editorial content and do not replace it.
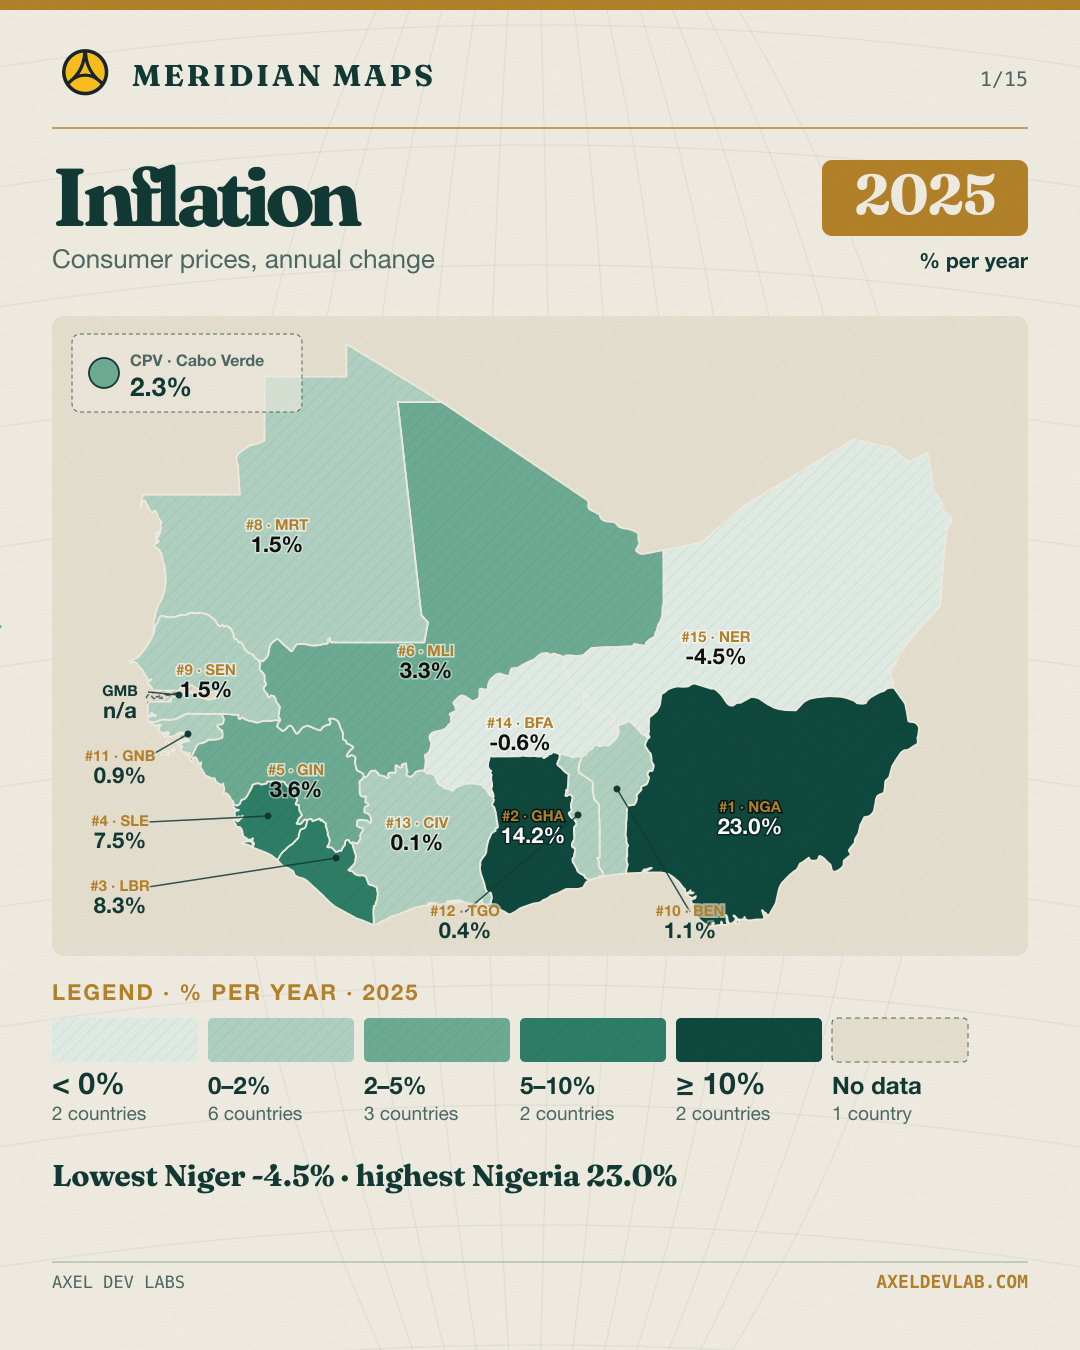
Consumer price inflation · 2025
Compare available West African country observations.
National values do not show differences within countries.
Read this data brief: https://library.axeldevlab.com/node/289
ADG production taxonomy
Adg Social Post
Social media card · promotional assetThis image and caption are short-form social distribution assets. They are separate from the full editorial content and do not replace it.Consumer price inflation · regional findingLowest inflation (d...
Oct 16, 2026 1 min read
Social media card · promotional asset
This image and caption are short-form social distribution assets. They are separate from the full editorial content and do not replace it.
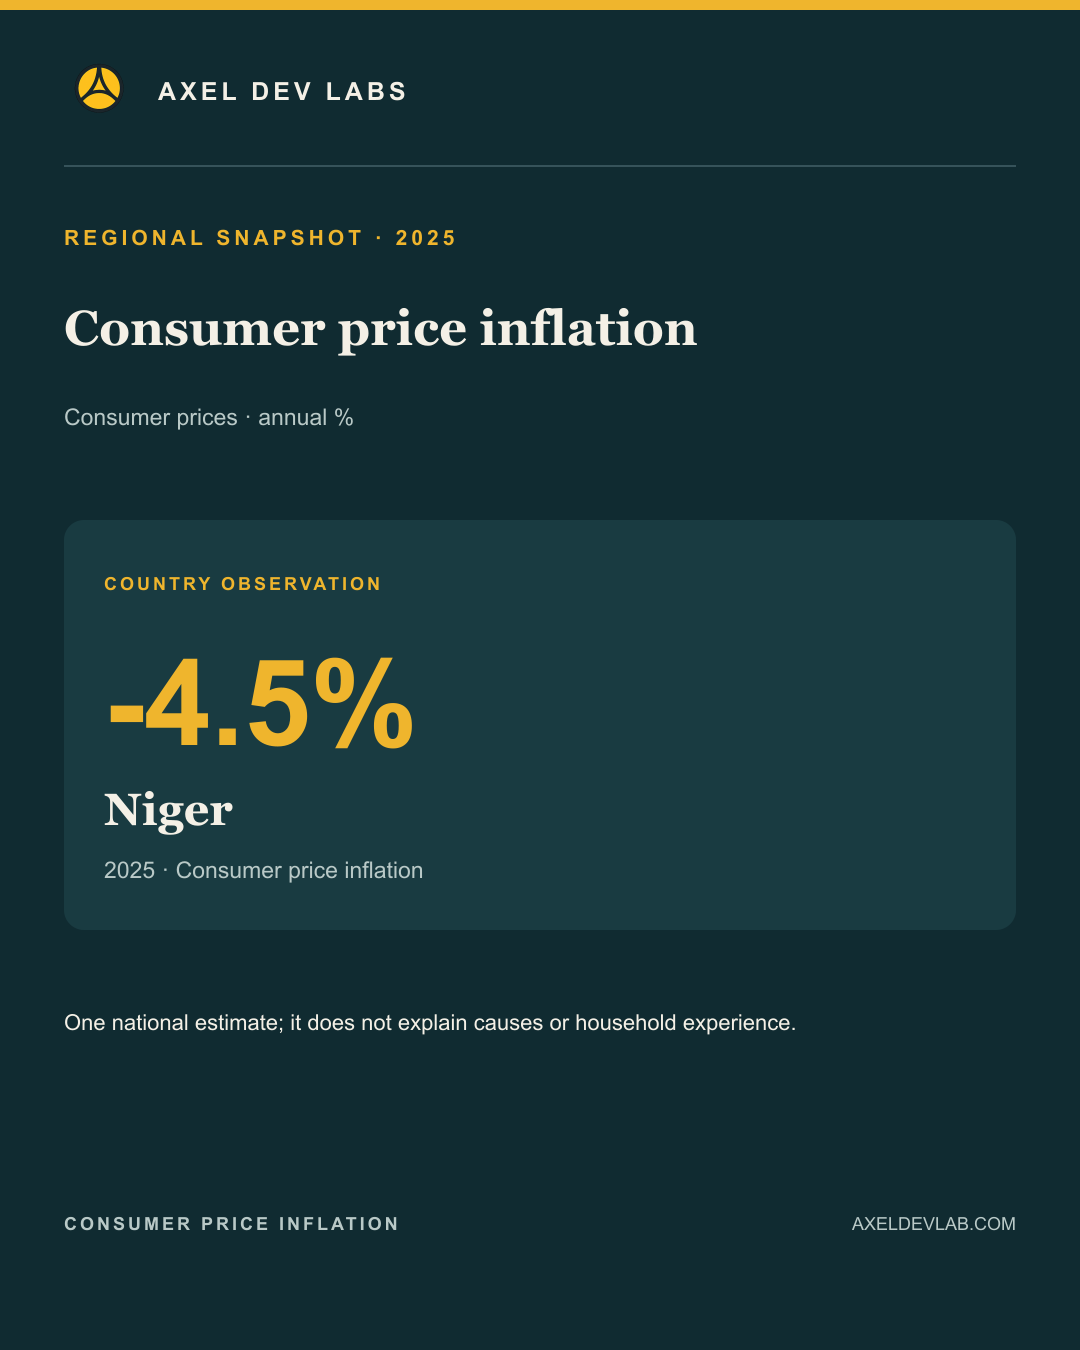
Consumer price inflation · regional finding
Lowest inflation (deflation): Niger -4.5% (2025).
A single national observation does not explain causes or household experience.
What local evidence would explain this national pattern?
Follow Axel Dev Lab for the next data card.
ADG production taxonomy
Adg Social Post
Social media card · promotional assetThis image and caption are short-form social distribution assets. They are separate from the full editorial content and do not replace it.Inflation across West AfricaA country comparison of annual con...
Oct 16, 2026 1 min read
Social media card · promotional asset
This image and caption are short-form social distribution assets. They are separate from the full editorial content and do not replace it.
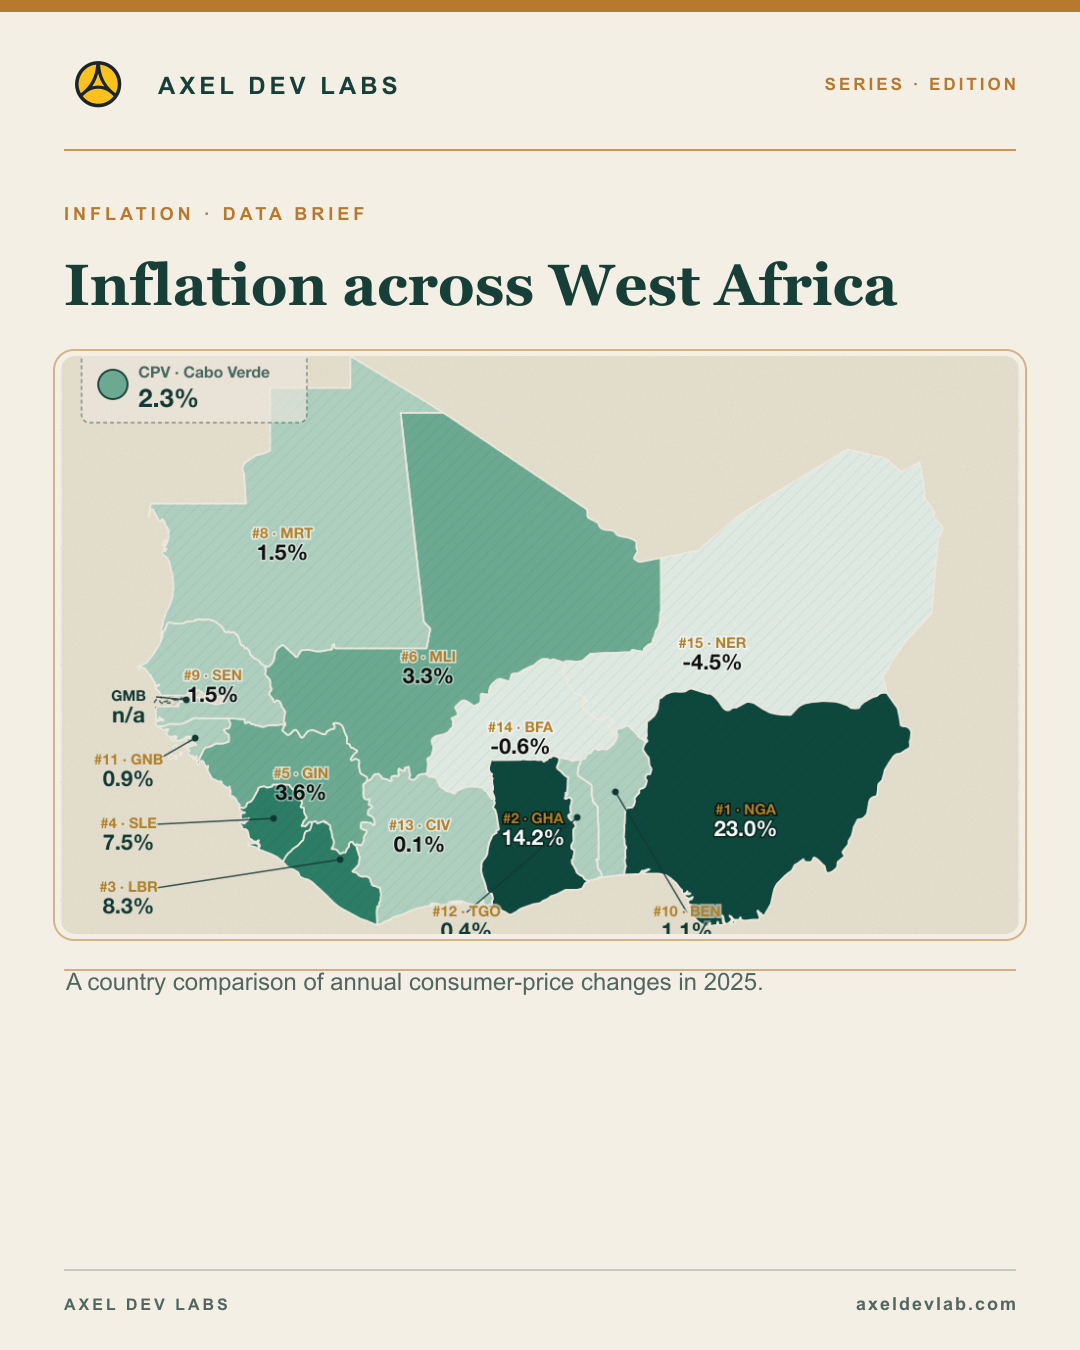
Inflation across West Africa
A country comparison of annual consumer-price changes in 2025.
2 sourced cards in this batch.
Read this edition: https://library.axeldevlab.com/node/289
ADG production taxonomy
Adg Social Post
Social media card · promotional assetThis image and caption are short-form social distribution assets. They are separate from the full editorial content and do not replace it.Which local conditions would help explain this gap without mis...
Oct 16, 2026 1 min read
Social media card · promotional asset
This image and caption are short-form social distribution assets. They are separate from the full editorial content and do not replace it.
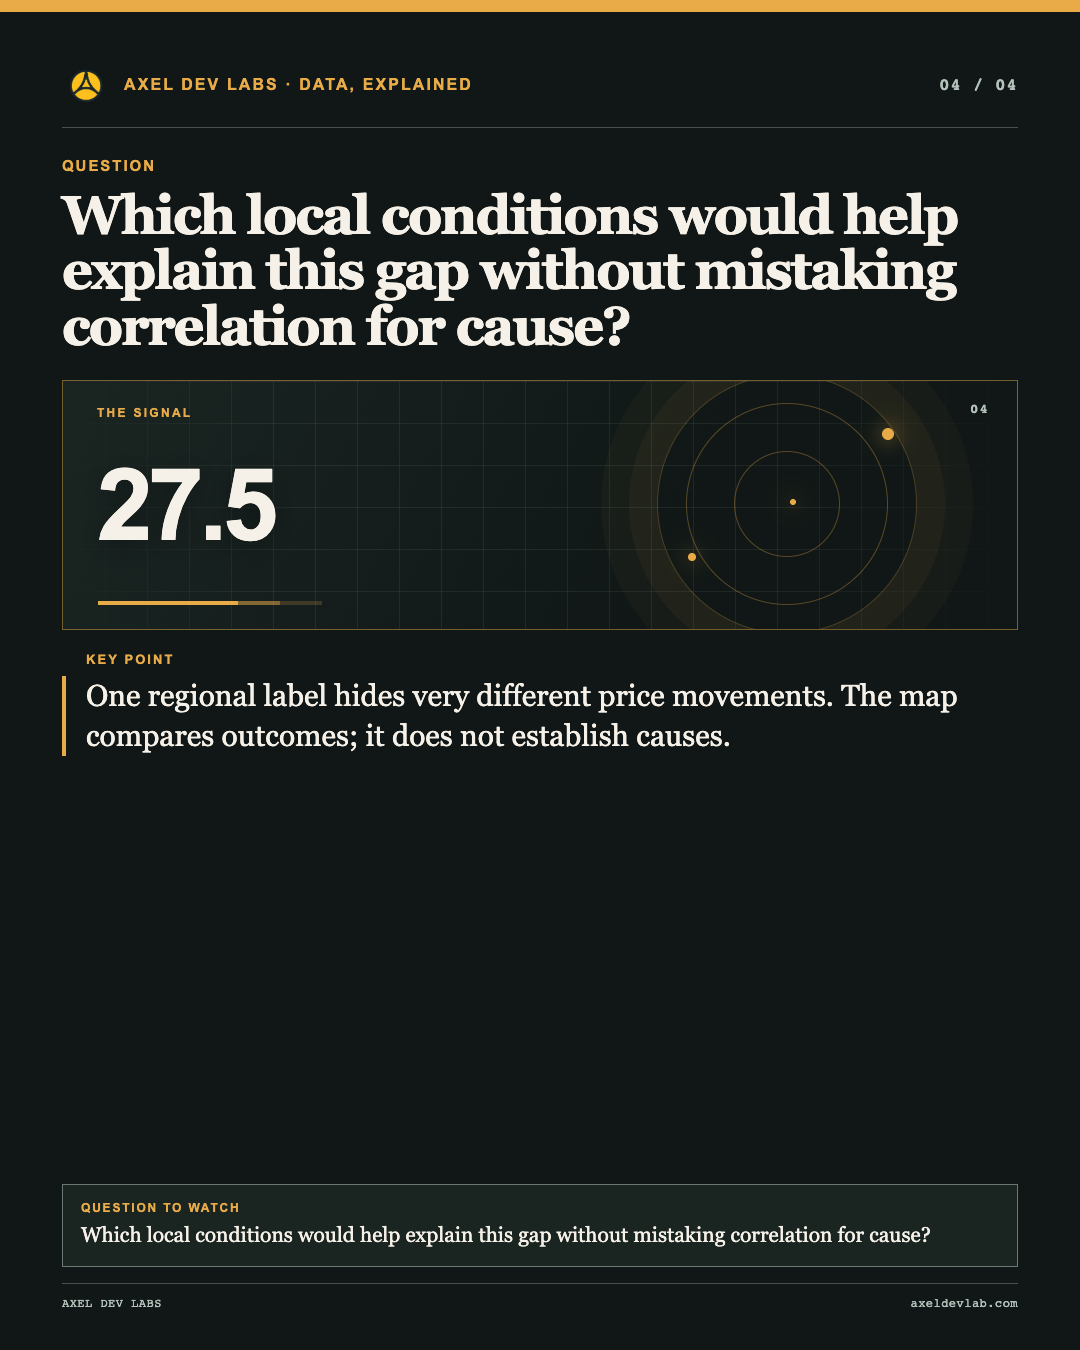
Which local conditions would help explain this gap without mistaking correlation for cause?
A 27.5-point span separates the highest and lowest values in this 15-country comparison.
One regional label hides very different price movements. The map compares outcomes; it does not establish causes.
Which local conditions would help explain this gap without mistaking correlation for cause?
Follow Axel Dev Lab, like and share this card. Subscribe for the next explainer.
ADG production taxonomy
Adg Social Post
Social media card · promotional assetThis image and caption are short-form social distribution assets. They are separate from the full editorial content and do not replace it.Why it mattersOne regional label hides very different price mo...
Oct 16, 2026 1 min read
Social media card · promotional asset
This image and caption are short-form social distribution assets. They are separate from the full editorial content and do not replace it.
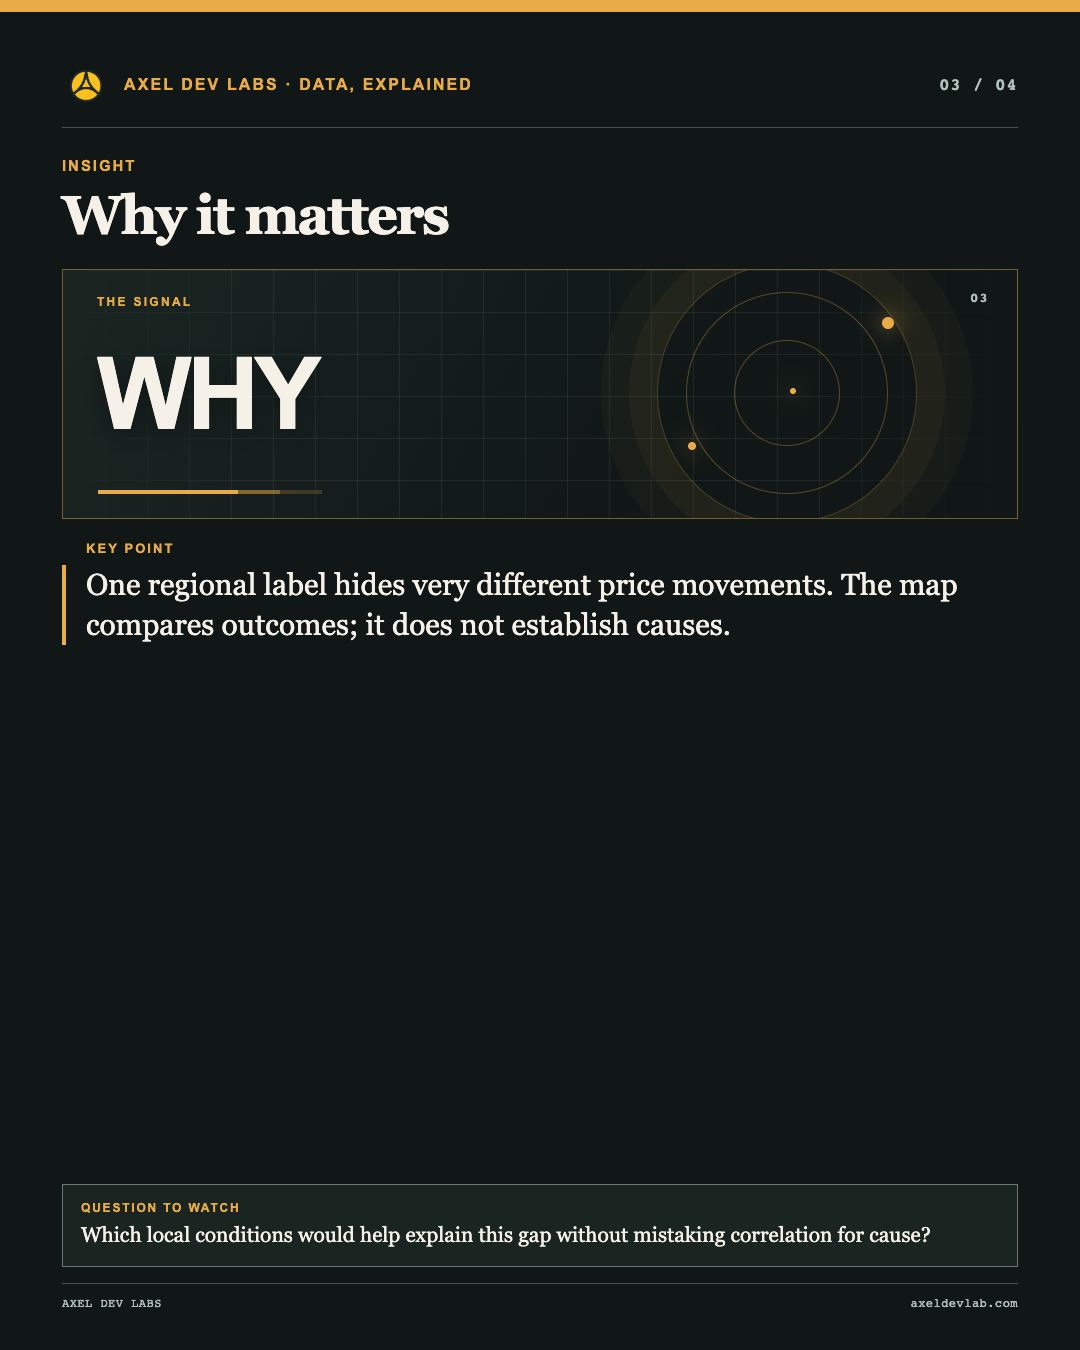
Why it matters
One regional label hides very different price movements. The map compares outcomes; it does not establish causes.
One regional label hides very different price movements. The map compares outcomes; it does not establish causes.
Which local conditions would help explain this gap without mistaking correlation for cause?
Follow Axel Dev Lab, like and share this card. Subscribe for the next explainer.
ADG production taxonomy
Adg Social Post
Social media card · promotional assetThis image and caption are short-form social distribution assets. They are separate from the full editorial content and do not replace it.Consumer price inflation · 2025A 27.5-point span separates the...
Oct 16, 2026 1 min read
Social media card · promotional asset
This image and caption are short-form social distribution assets. They are separate from the full editorial content and do not replace it.
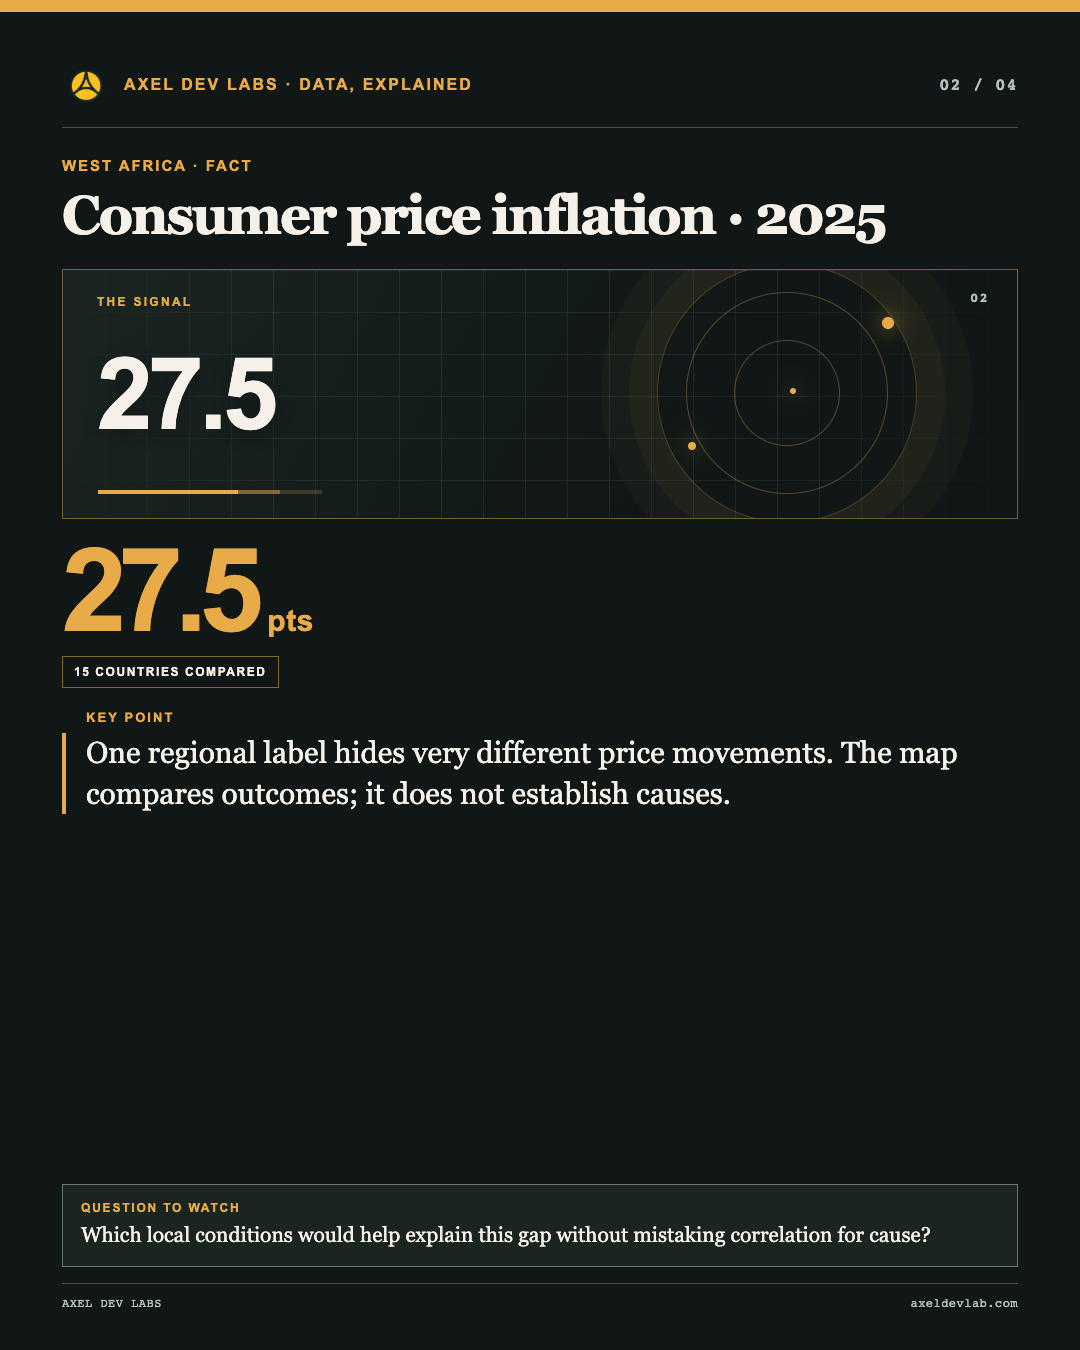
Consumer price inflation · 2025
A 27.5-point span separates the highest and lowest values in this 15-country comparison.
One regional label hides very different price movements. The map compares outcomes; it does not establish causes.
Which local conditions would help explain this gap without mistaking correlation for cause?
Follow Axel Dev Lab, like and share this card. Subscribe for the next explainer.
ADG production taxonomy
No results found
Try adjusting your search or filters.