Adg Social Post
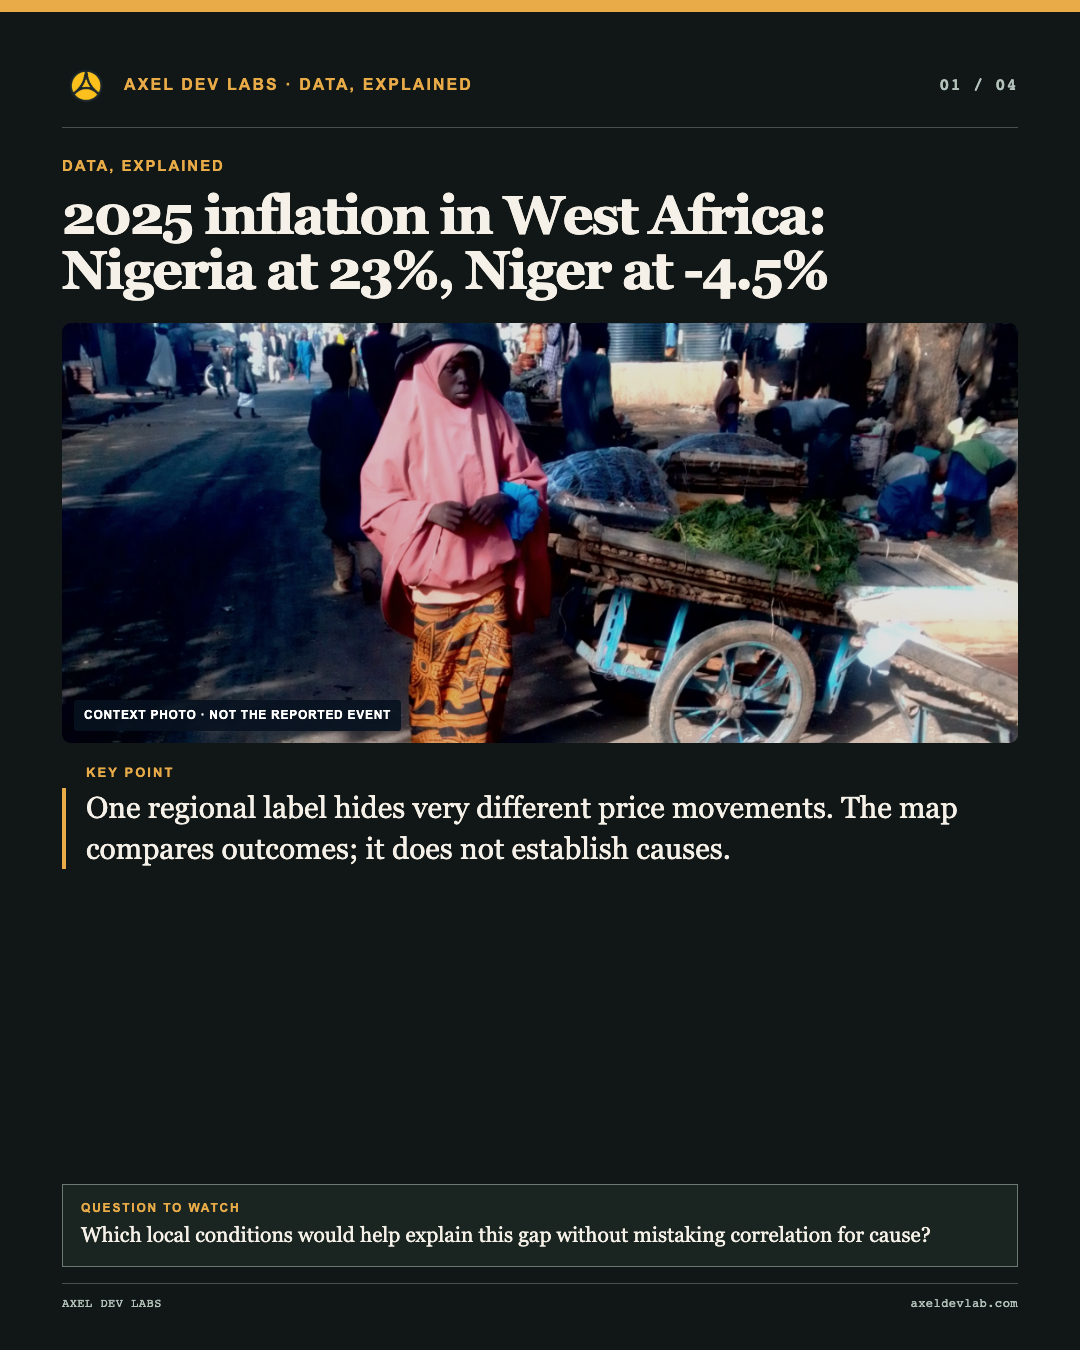
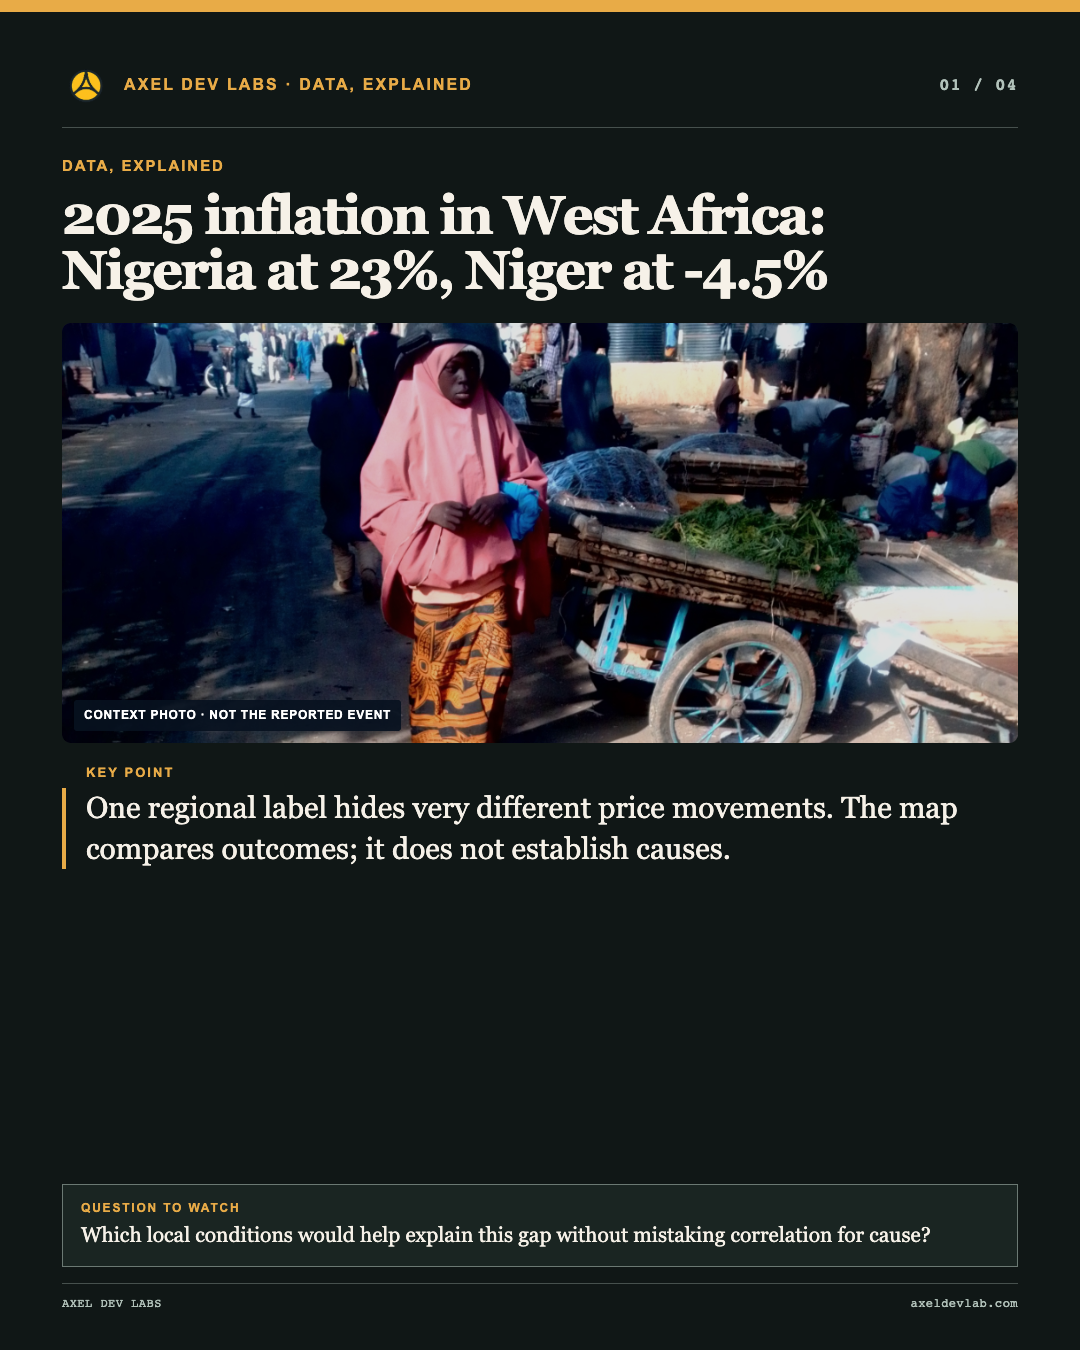
2025 inflation in West Africa: Nigeria at 23%, Niger at -4.5%

Social media card · promotional asset

This image and caption are short-form social distribution assets. They are separate from the full editorial content and do not replace it.

2025 inflation in West Africa: Nigeria at 23%, Niger at -4.5%

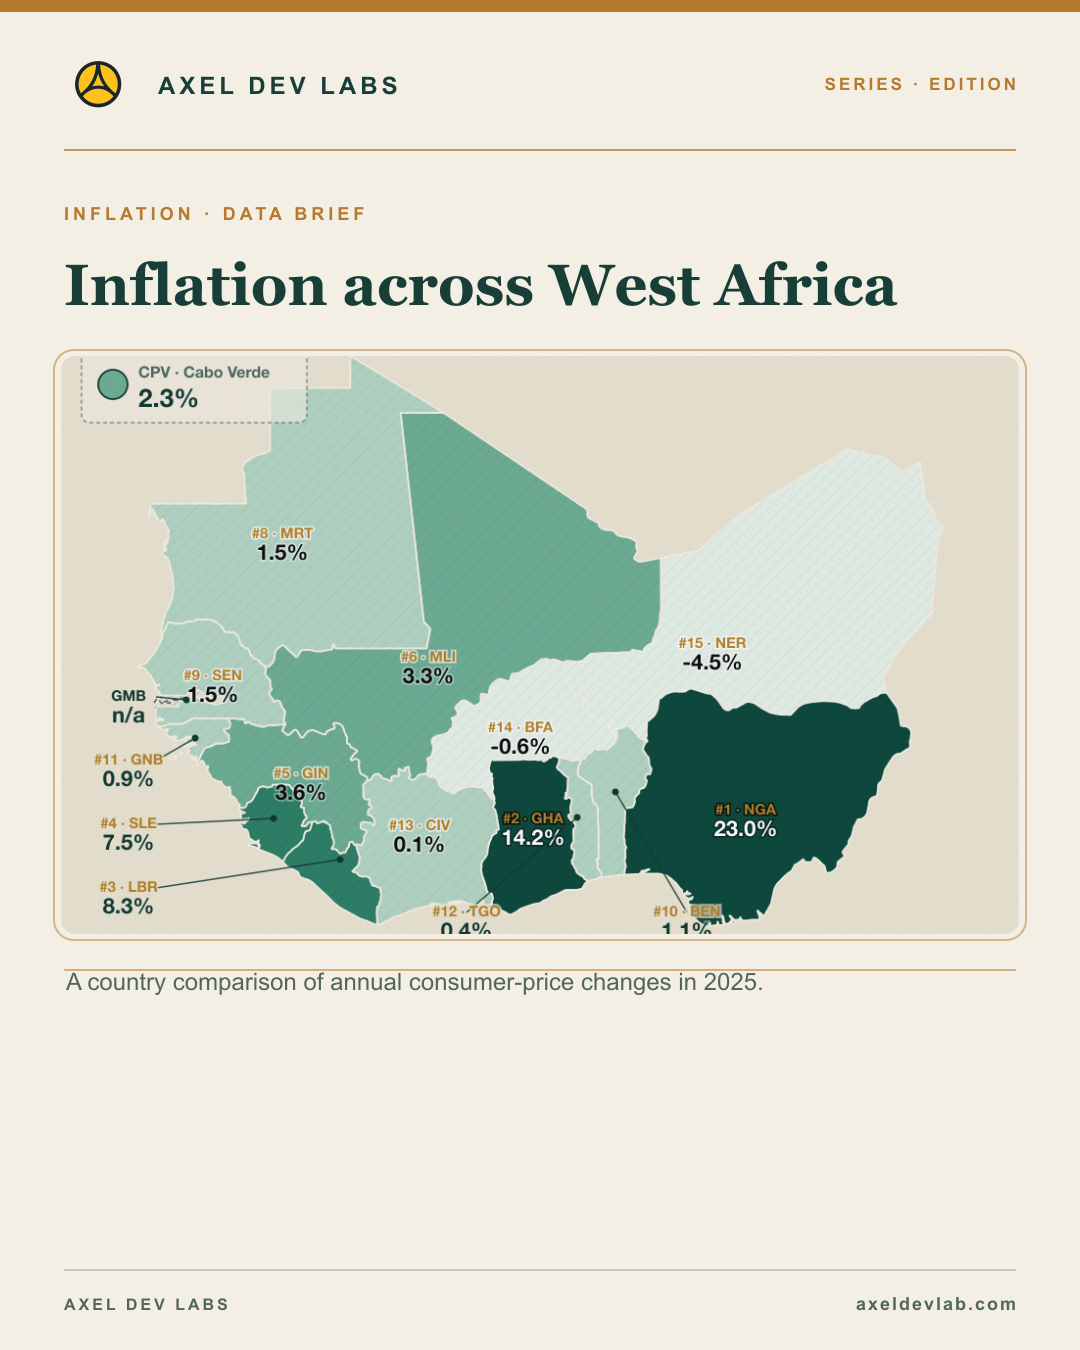
A 27.5-point span separates the highest and lowest values in this 15-country comparison.

One regional label hides very different price movements. The map compares outcomes; it does not establish causes.

Which local conditions would help explain this gap without mistaking correlation for cause?

Follow Axel Dev Lab, like and share this card. Subscribe for the next explainer.
More information and data

Read the complete edition

Adg Publication Day
Adg Publication Day
Adg Production Series

Short-form data explainers; TikTok is a distribution channel, not the series identity.

Current editions

Adg Editorial Edition
Inflation across West Africa

Editorial content. This page contains the full editorial reading. Social media cards are separate promotional assets, shown in their own section.

Read the edition

Series · Publication day · Credits and sources

Consumer price inflation · regional finding

The development: Lowest inflation (deflation): Niger -4.5% (2025).

What the evidence says: A single national observation does not explain causes or household experience.

Question to watch: What local evidence would explain this national pattern?

Consumer price inflation · 2025

The development: Compare available West African country observations.

What the evidence says: National values do not show differences within countries.

Social media cards · separate promotional assets

Each link opens a social-ready card image, its platform caption and permanent post URL. These assets do not replace the editorial content above.

Adg Editorial Edition
2025 inflation in West Africa: Nigeria at 23%, Niger at -4.5%

Editorial content. This page contains the full editorial reading. Social media cards are separate promotional assets, shown in their own section.

Read the edition

Series · Publication day · Credits and sources

Consumer price inflation · 2025

The development: A 27.5-point span separates the highest and lowest values in this 15-country comparison.

What the evidence says: One regional label hides very different price movements. The map compares outcomes; it does not establish causes.

Question to watch: Which local conditions would help explain this gap without mistaking correlation for cause?

Why it matters

The development: One regional label hides very different price movements. The map compares outcomes; it does not establish causes.

What the evidence says: One regional label hides very different price movements. The map compares outcomes; it does not establish causes.

Question to watch: Which local conditions would help explain this gap without mistaking correlation for cause?

Which local conditions would help explain this gap without mistaking correlation for cause?

The development: A 27.5-point span separates the highest and lowest values in this 15-country comparison.

What the evidence says: One regional label hides very different price movements. The map compares outcomes; it does not establish causes.

Question to watch: Which local conditions would help explain this gap without mistaking correlation for cause?

Social media cards · separate promotional assets

Each link opens a social-ready card image, its platform caption and permanent post URL. These assets do not replace the editorial content above.

No results found

Try adjusting your search or filters.