Adg Credit Record
QR code linking to this publication batch

Editorial direction, concept and publication: Jean-Axel Désiré Tohougbé · ADG Lab.

Series · Production batch · Read the full edition · Publication day

QR code and link to this publication batch

https://library.axeldevlab.com/library/batches/meridian-maps-decade/2026-10-15/en

Permanent link to this credit page

Cards in this edition

  1. Meridian Maps · Ten-year regional trends · Highest inflation in the region
  2. Access to electricity: ten years of change
  3. Consumer price inflation: ten years of change
  4. Real GDP growth: ten years of change
  5. GDP per person: ten years of change
  6. Unemployment: ten years of change
  7. Highest inflation in the region
  8. GDP growth 2025
  9. Inflation 2025
  10. Unemployment 2025

Visual asset credits

  • Highest inflation in the region — Boundaries: Natural Earth; flags: authentic national flags
  • GDP growth 2025 — Boundaries: Natural Earth
  • Inflation 2025 — Boundaries: Natural Earth
  • Unemployment 2025 — Boundaries: Natural Earth
  • Ten years. Five signals. — Original ADG chart-led cover using the published decade series; data sources and limitations are on the separate credit page.
  • GDP per person: ten years of change — Chart generated by Axel Dev Lab from World Bank WDI national observations; no external imagery.
  • Real GDP growth: ten years of change — Chart generated by Axel Dev Lab from World Bank WDI national observations; no external imagery.
  • Unemployment: ten years of change — Chart generated by Axel Dev Lab from World Bank WDI national observations; no external imagery.
  • Consumer price inflation: ten years of change — Chart generated by Axel Dev Lab from World Bank WDI national observations; no external imagery.
  • Access to electricity: ten years of change — Chart generated by Axel Dev Lab from World Bank WDI national observations; no external imagery.

Editorial references

  • World Development Indicators · FP.CPI.TOTL.ZG
  • World Development Indicators · NY.GDP.MKTP.KD.ZG
  • World Development Indicators · SL.UEM.TOTL.ZS
  • World Development Indicators · NY.GDP.PCAP.KD · 2015:2025
  • World Development Indicators · NY.GDP.MKTP.KD.ZG · 2015:2025
  • World Development Indicators · SL.UEM.TOTL.ZS · 2015:2025
  • World Development Indicators · FP.CPI.TOTL.ZG · 2015:2025
  • World Development Indicators · EG.ELC.ACCS.ZS · 2015:2024
Adg Credit Record
QR code linking to this publication batch

Editorial direction, concept and publication: Jean-Axel Désiré Tohougbé · ADG Lab.

Series · Production batch · Read the full edition · Publication day

QR code and link to this publication batch

https://library.axeldevlab.com/library/batches/mac-meridian-gdp/2026-10-15/en

Permanent link to this credit page

Cards in this edition

  1. West Africa GDP per capita · 2025
  2. How countries compare with the regional mean
  3. Reading the GDP per capita map
  4. GDP per capita
  5. What GDP per capita leaves out

Visual asset credits

  • West Africa GDP per capita · 2025 — Original ADG map-led cover using the series map; detailed data and asset sources are on the separate credit page.
  • How countries compare with the regional mean — data: World Bank
  • Reading the GDP per capita map — Natural Earth 1:10m Admin 0 · data: World Bank
  • GDP per capita — Natural Earth 1:10m Admin 0 · data: World Bank
  • What GDP per capita leaves out — data: World Bank

Editorial references

  • World Development Indicators · NY.GDP.PCAP.CD · 2025
Adg Credit Record
QR code linking to this publication batch

Editorial direction, concept and publication: Jean-Axel Désiré Tohougbé · ADG Lab.

Series · Production batch · Read the full edition · Publication day

QR code and link to this publication batch

https://library.axeldevlab.com/library/batches/mac-meridian/2026-10-15/en

Permanent link to this credit page

Cards in this edition

  1. Unemployment across West Africa
  2. Unemployment by country · 2025

Visual asset credits

  • Unemployment across West Africa — Original ADG map-led cover using the series map; detailed data and asset sources are on the separate credit page.
  • Unemployment by country · 2025 — Natural Earth boundary geometry · data: world_bank_api_v2

Editorial references

  • World Development Indicators · SL.UEM.TOTL.ZS
Adg Credit Record
QR code linking to this publication batch

Editorial direction, concept and publication: Jean-Axel Désiré Tohougbé · ADG Lab.

Series · Production batch · Read the full edition · Publication day

QR code and link to this publication batch

https://library.axeldevlab.com/library/batches/adg-insight-maps/2026-10-15/en

Permanent link to this credit page

Cards in this edition

  1. Where electricity reaches
  2. Electricity access varies.
  3. Electricity access: two extremes.
  4. A national rate is not a local map.

Visual asset credits

  • Where electricity reaches — Original ADG map-led cover using the series map; detailed data and asset sources are on the separate credit page.
  • Electricity access varies. — Natural Earth 1:50m · public domain
  • Electricity access: two extremes. — Authentic flags: flag-icons v7.3.2 · MIT
  • A national rate is not a local map. — TheNyxx · A power line in Ibadan · CC BY 4.0 · cropped · Check source and rights

Editorial references

  • World Development Indicators · EG.ELC.ACCS.ZS
Adg Credit Record
QR code linking to this publication batch

Editorial direction, concept and publication: Jean-Axel Désiré Tohougbé · ADG Lab.

Series · Production batch · Read the full edition · Publication day

QR code and link to this publication batch

https://library.axeldevlab.com/library/batches/meridian-maps/2026-10-15/en

Permanent link to this credit page

Cards in this edition

  1. GDP per capita · 2025
  2. The distribution

Visual asset credits

  • GDP per capita · 2025 — Original ADG map-led cover; detailed data and asset sources are on the separate credit page.
  • The distribution — Original ADG distribution and flag layout; full source/asset register appears on the separate credits page.

Editorial references

  • World Development Indicators · NY.GDP.PCAP.CD · 2025
Adg Social Post
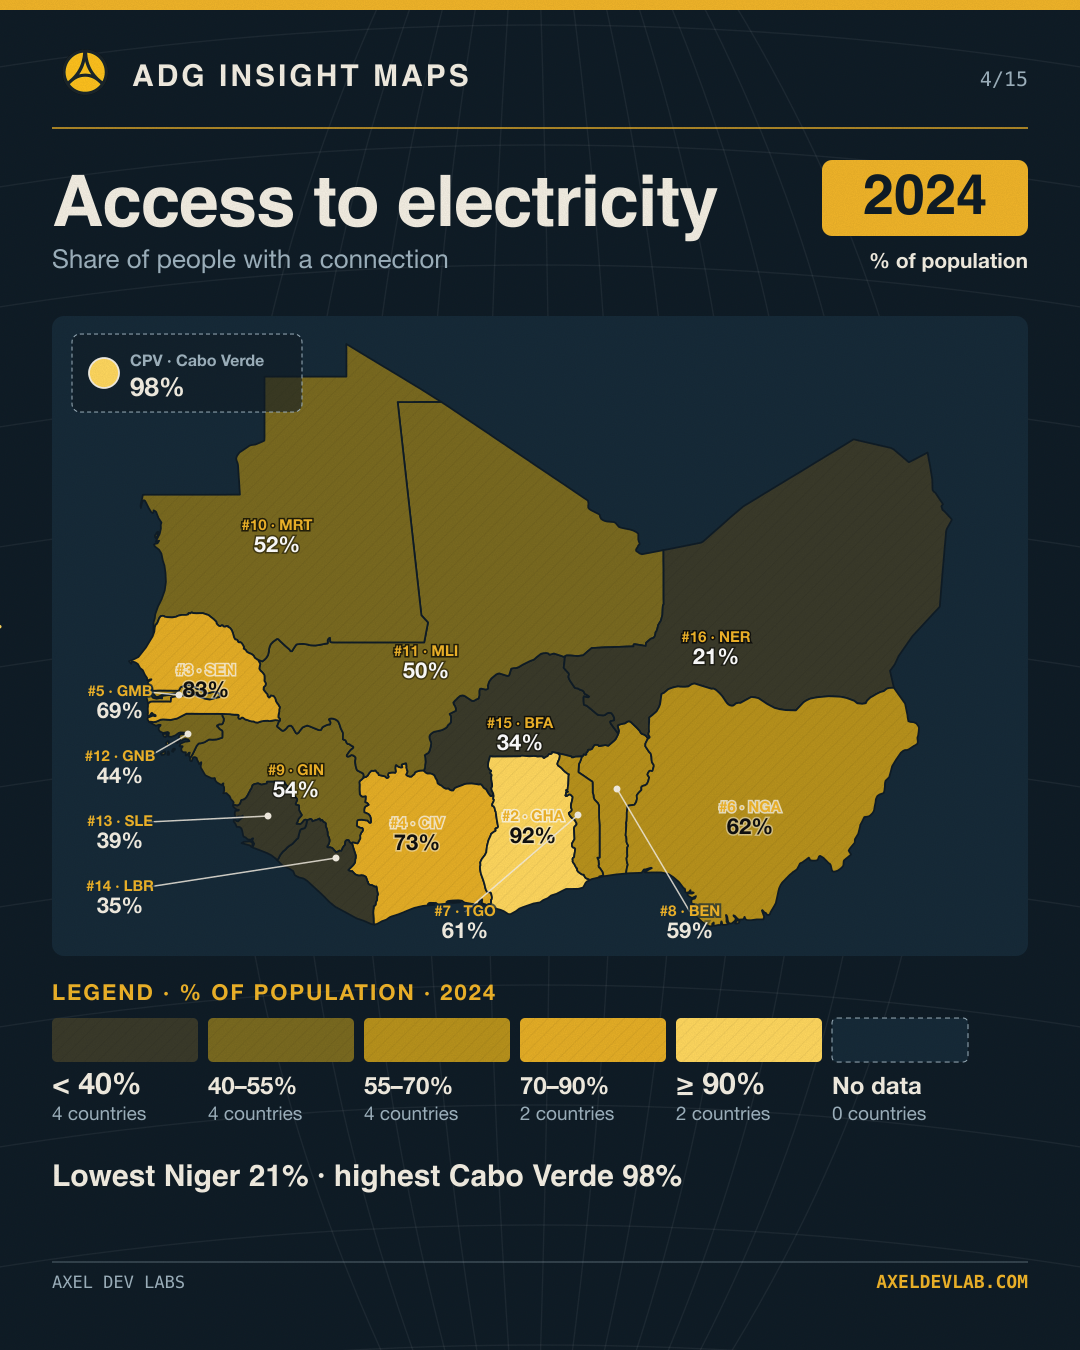
Access to electricity 2024

Social media card · promotional asset

This image and caption are short-form social distribution assets. They are separate from the full editorial content and do not replace it.

Access to electricity 2024

Access to electricity 2024: where does your country sit?

Five classed ranges, with the number of countries in each. Lowest Niger 21% · highest Cabo Verde 98%.

Which of these gaps matters most for your country?

Follow Axel Dev Lab for the next data card.

More information and data

Read the complete edition

Adg Social Post
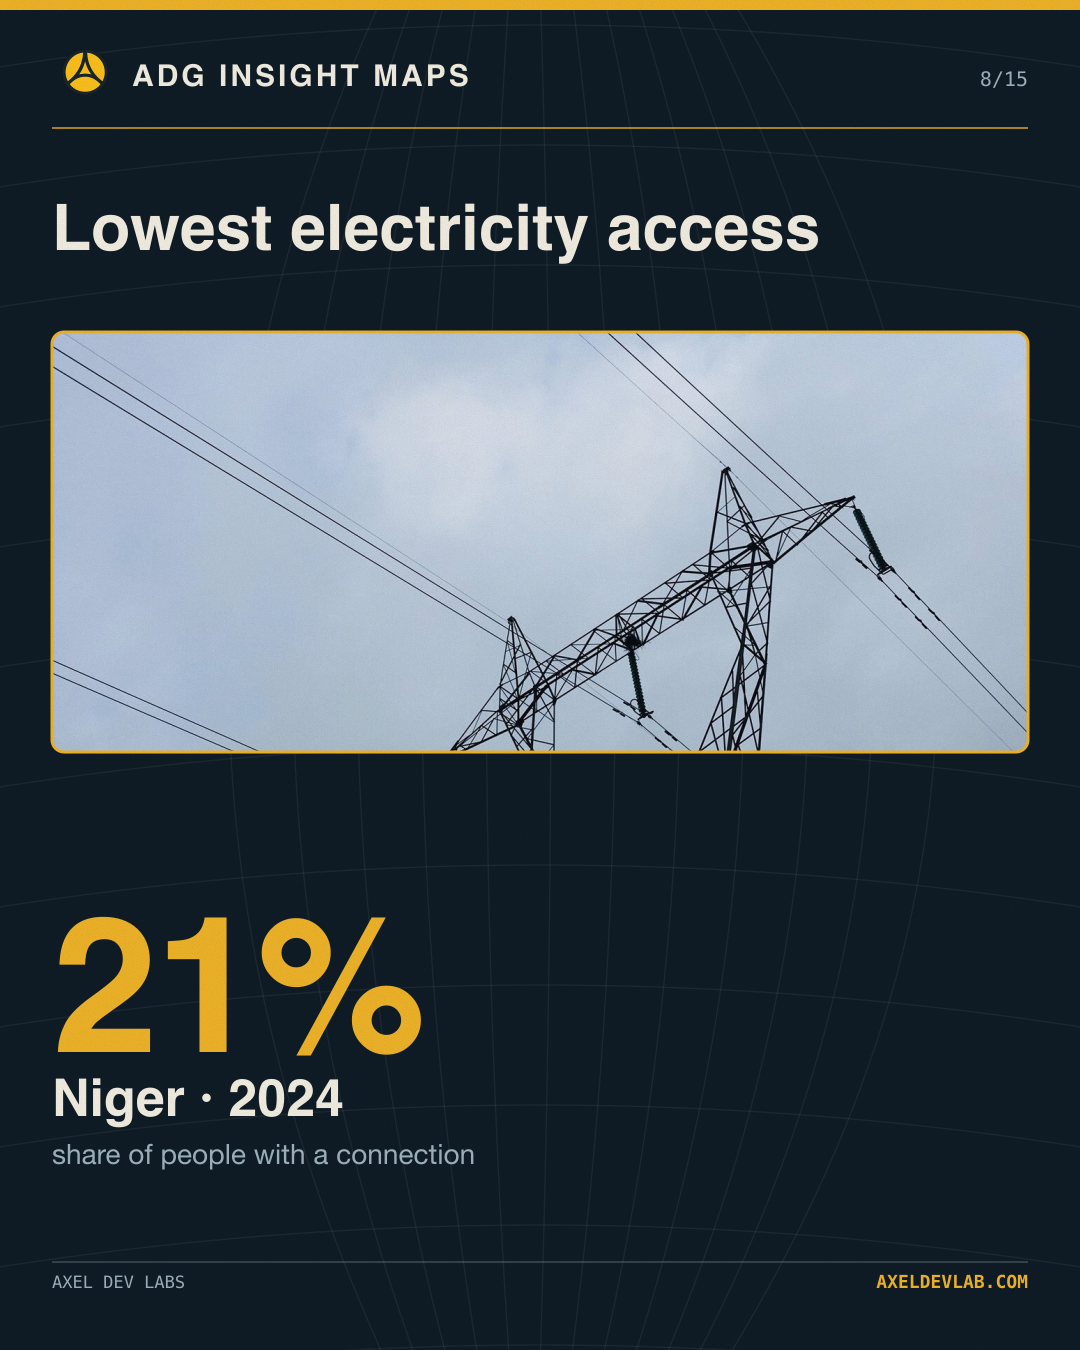
Lowest electricity access

Social media card · promotional asset

This image and caption are short-form social distribution assets. They are separate from the full editorial content and do not replace it.

Lowest electricity access

Lowest electricity access: Niger 21% (2024).

One figure, one country, one year. Source: World Bank WDI.

Which of these gaps matters most for your country?

Follow Axel Dev Lab for the next data card.

More information and data

Read the complete edition

Adg Social Post
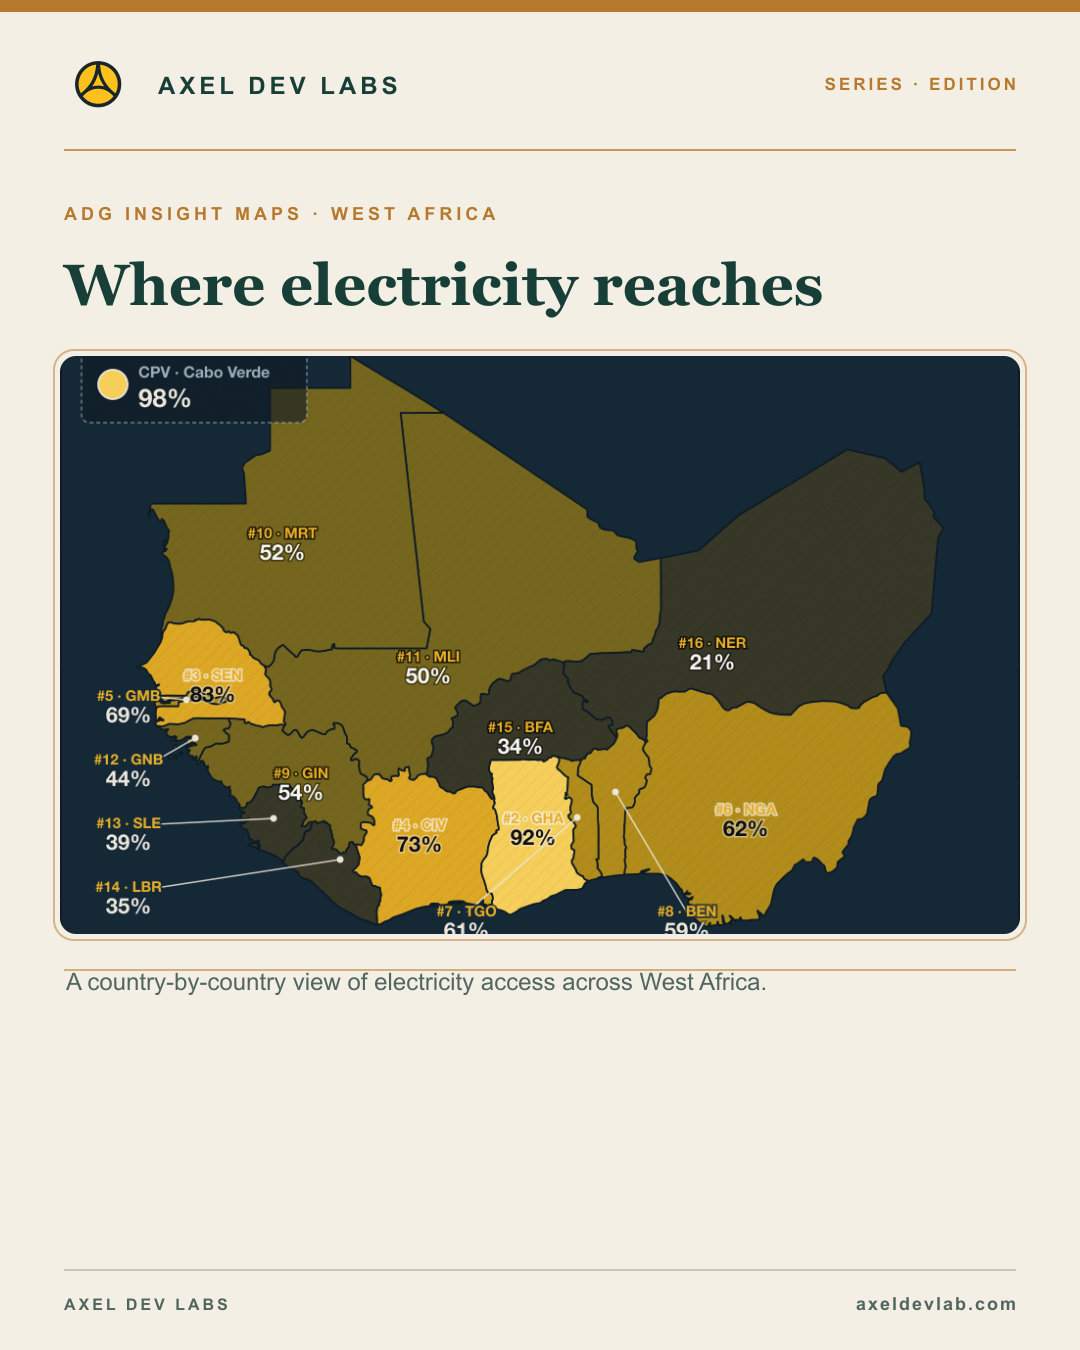
Where electricity reaches

Social media card · promotional asset

This image and caption are short-form social distribution assets. They are separate from the full editorial content and do not replace it.

Where electricity reaches

A country-by-country view of electricity access across West Africa.

2 sourced cards in this batch.

Read this edition: https://library.axeldevlab.com/node/279

More information and data

Read the complete edition

Adg Social Post
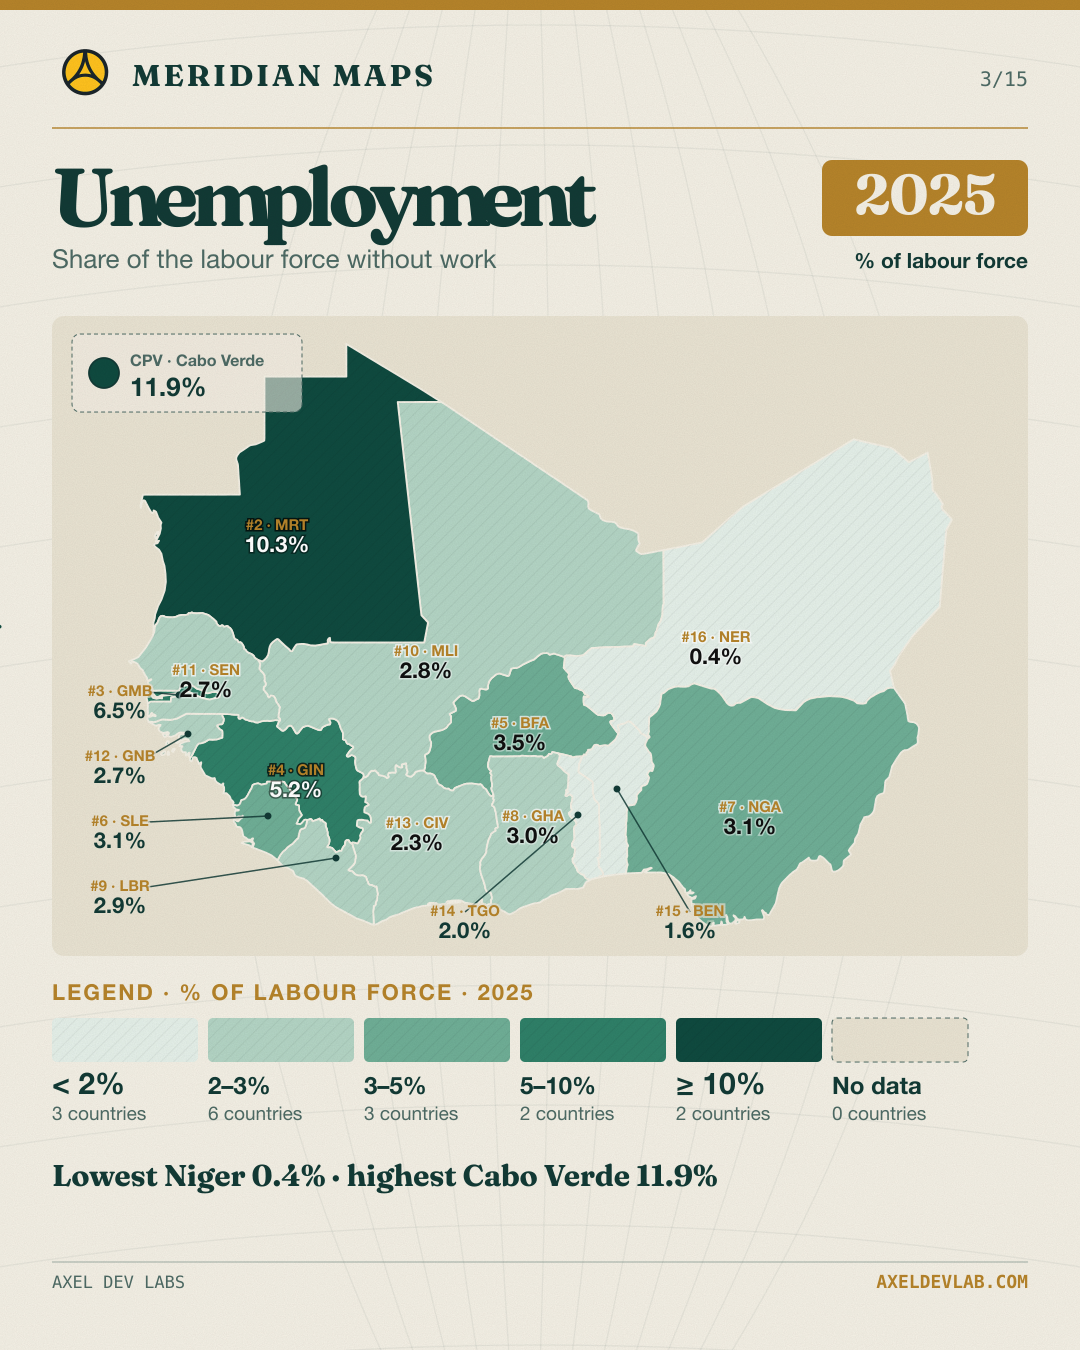
Unemployment 2025

Social media card · promotional asset

This image and caption are short-form social distribution assets. They are separate from the full editorial content and do not replace it.

Unemployment 2025

Unemployment 2025: where does your country sit?

Five classed ranges, with the number of countries in each. Lowest Niger 0.4% · highest Cabo Verde 11.9%.

Which of these gaps matters most for your country?

Follow Axel Dev Lab for the next data card.

More information and data

Read the complete edition

Adg Social Post
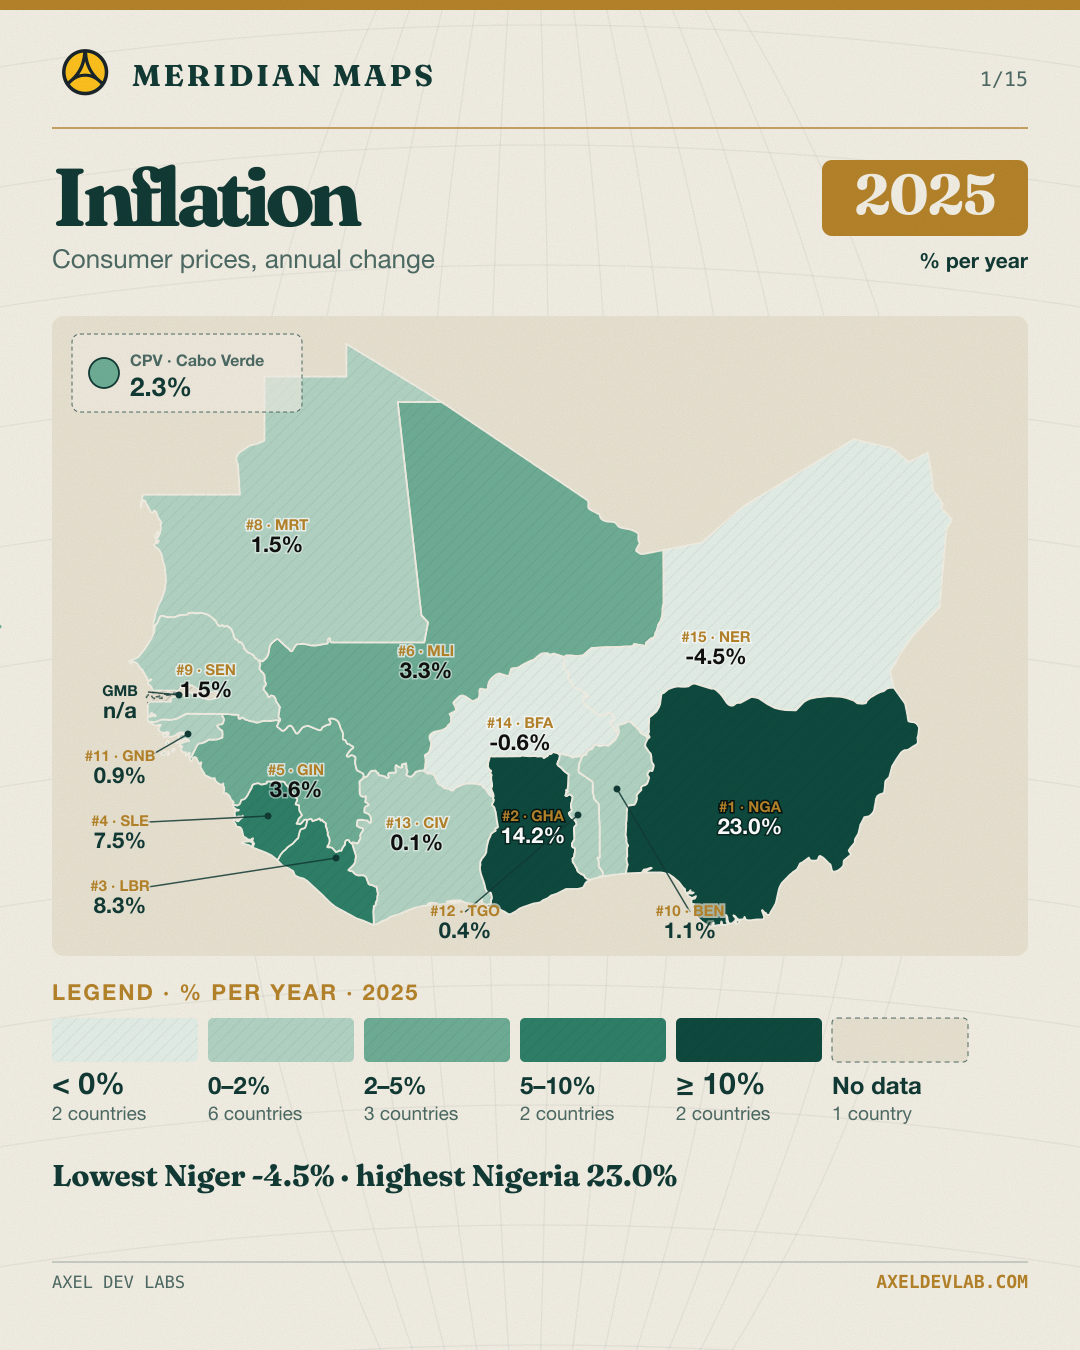
Inflation 2025

Social media card · promotional asset

This image and caption are short-form social distribution assets. They are separate from the full editorial content and do not replace it.

Inflation 2025

Inflation 2025: where does your country sit?

Five classed ranges, with the number of countries in each. Lowest Niger -4.5% · highest Nigeria 23.0%.

Which of these gaps matters most for your country?

Follow Axel Dev Lab for the next data card.

More information and data

Read the complete edition

No results found

Try adjusting your search or filters.