
Back to the library
Chart or graphic
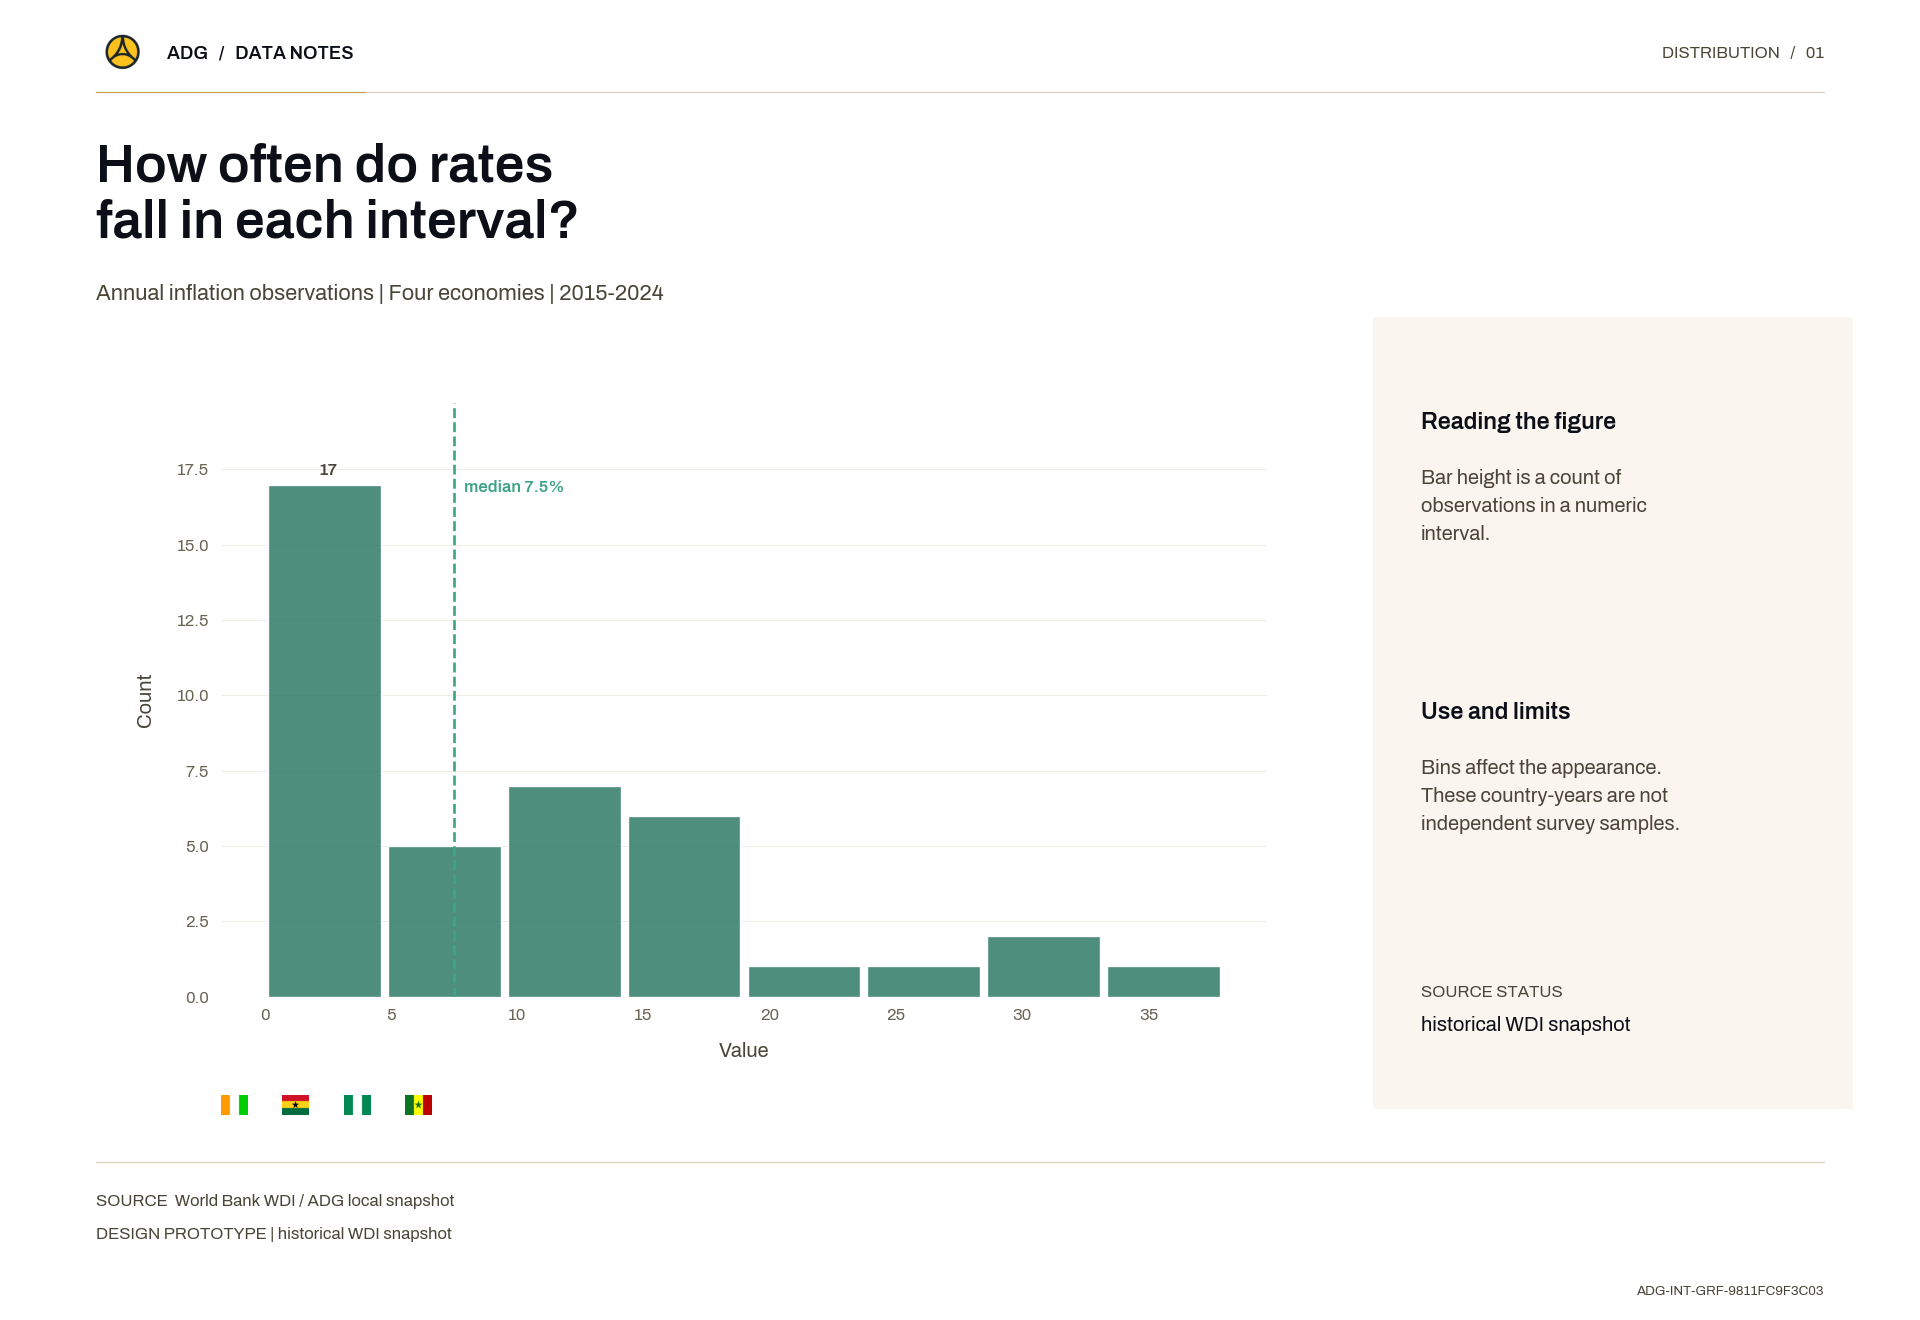
How often do rates fall in each interval?
Public ID
ADG-GFX-2026-022
31 words · about a minute
Your browser cannot read text aloud. The written text is above.
La hauteur d'une barre est un nombre d'observations dans un intervalle numérique.
How this was made
Bins affect the appearance. These country-years are not independent survey samples.
How to cite
ADG Library Editorial (11 September 2026). How often do rates fall in each interval?. Axel Dev Group — ADG Library, Maps visualization ADG-GFX-2026-022. https://library.axeldevlab.com/index.php/node/238
@techreport{ADG-GFX-2026-022,
  title       = {{How often do rates fall in each interval?}},
  author      = {ADG Library Editorial},
  institution = {Axel Dev Group --- ADG Library},
  type        = {Maps visualization},
  number      = {ADG-GFX-2026-022},
  year        = {2026},
  url         = {https://library.axeldevlab.com/index.php/node/238}
}
TY  - RPRT
TI  - How often do rates fall in each interval?
AU  - ADG Library Editorial
PY  - 2026
PB  - Axel Dev Group — ADG Library
M1  - ADG-GFX-2026-022
UR  - https://library.axeldevlab.com/index.php/node/238
ER  -