
Adg Social Post
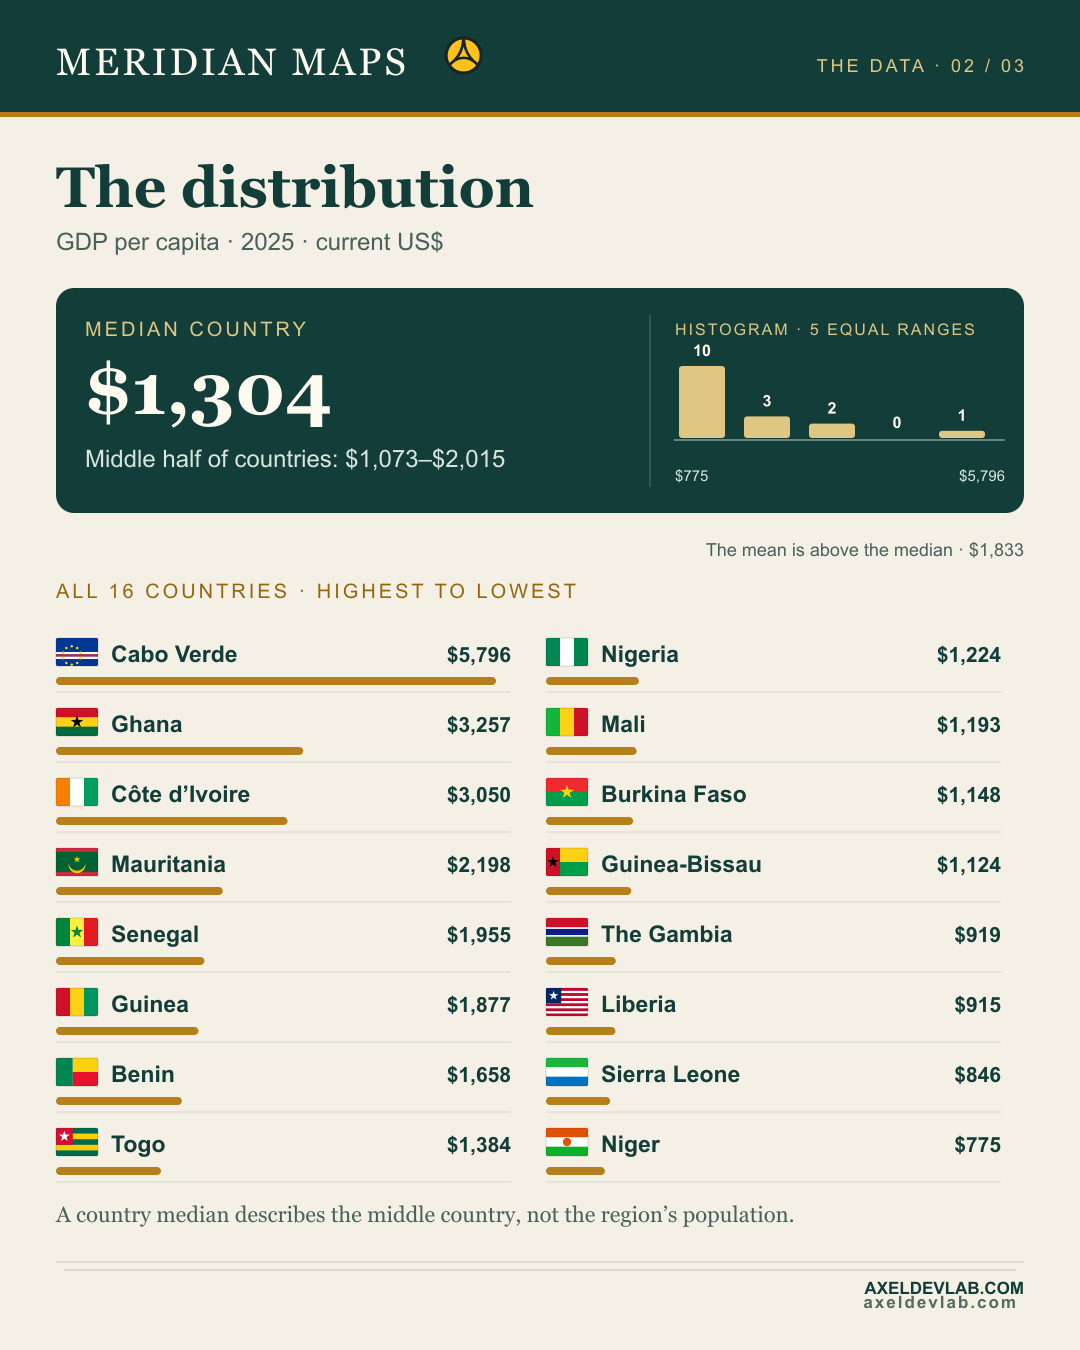
How countries compare with the regional mean
82 words · about a minute
Your browser cannot read text aloud. The written text is above.
Social media card · promotional asset
This image and caption are short-form social distribution assets. They are separate from the full editorial content and do not replace it.
How countries compare with the regional mean
current US$ · 2025 · Fixed class edges, so years can be compared directly.
The median and mean answer different questions.
Why do the mean and median differ here?
Follow Axel Dev Lab, like and share this map. Subscribe for the next maps.
How to cite
ADG Library Editorial (16 October 2026). How countries compare with the regional mean. Axel Dev Group — ADG Library, Adg social post ADG-adg_social_post-401. https://library.axeldevlab.com/index.php/library/posts/mac-meridian-gdp/2026-10-15/en/distribution-en-png
@techreport{ADG-adg_social_post-401,
  title       = {{How countries compare with the regional mean}},
  author      = {ADG Library Editorial},
  institution = {Axel Dev Group --- ADG Library},
  type        = {Adg social post},
  number      = {ADG-adg_social_post-401},
  year        = {2026},
  url         = {https://library.axeldevlab.com/index.php/library/posts/mac-meridian-gdp/2026-10-15/en/distribution-en-png}
}
TY  - RPRT
TI  - How countries compare with the regional mean
AU  - ADG Library Editorial
PY  - 2026
PB  - Axel Dev Group — ADG Library
M1  - ADG-adg_social_post-401
UR  - https://library.axeldevlab.com/index.php/library/posts/mac-meridian-gdp/2026-10-15/en/distribution-en-png
ER  -