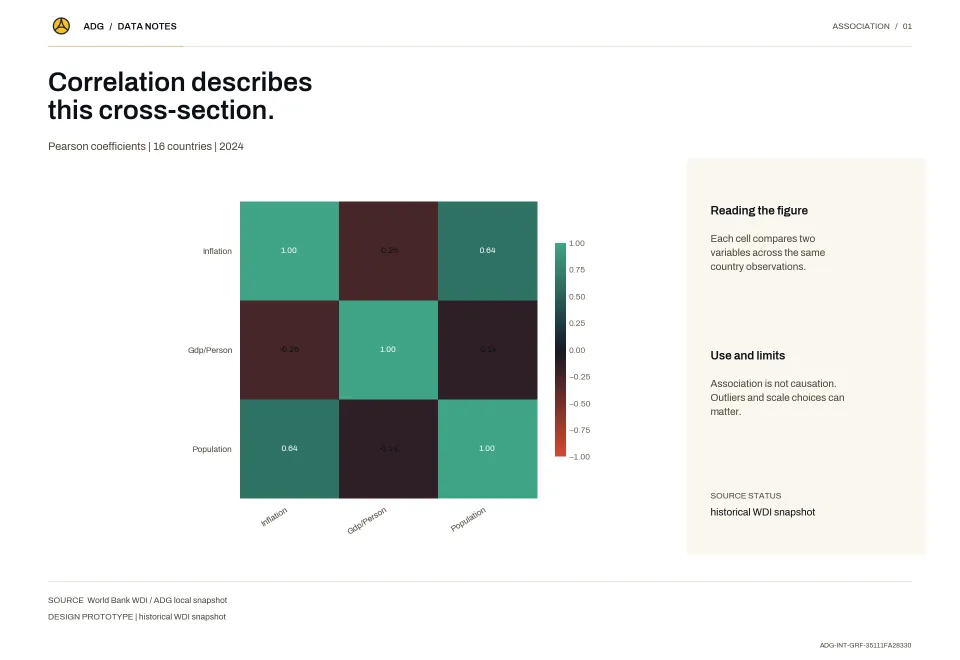
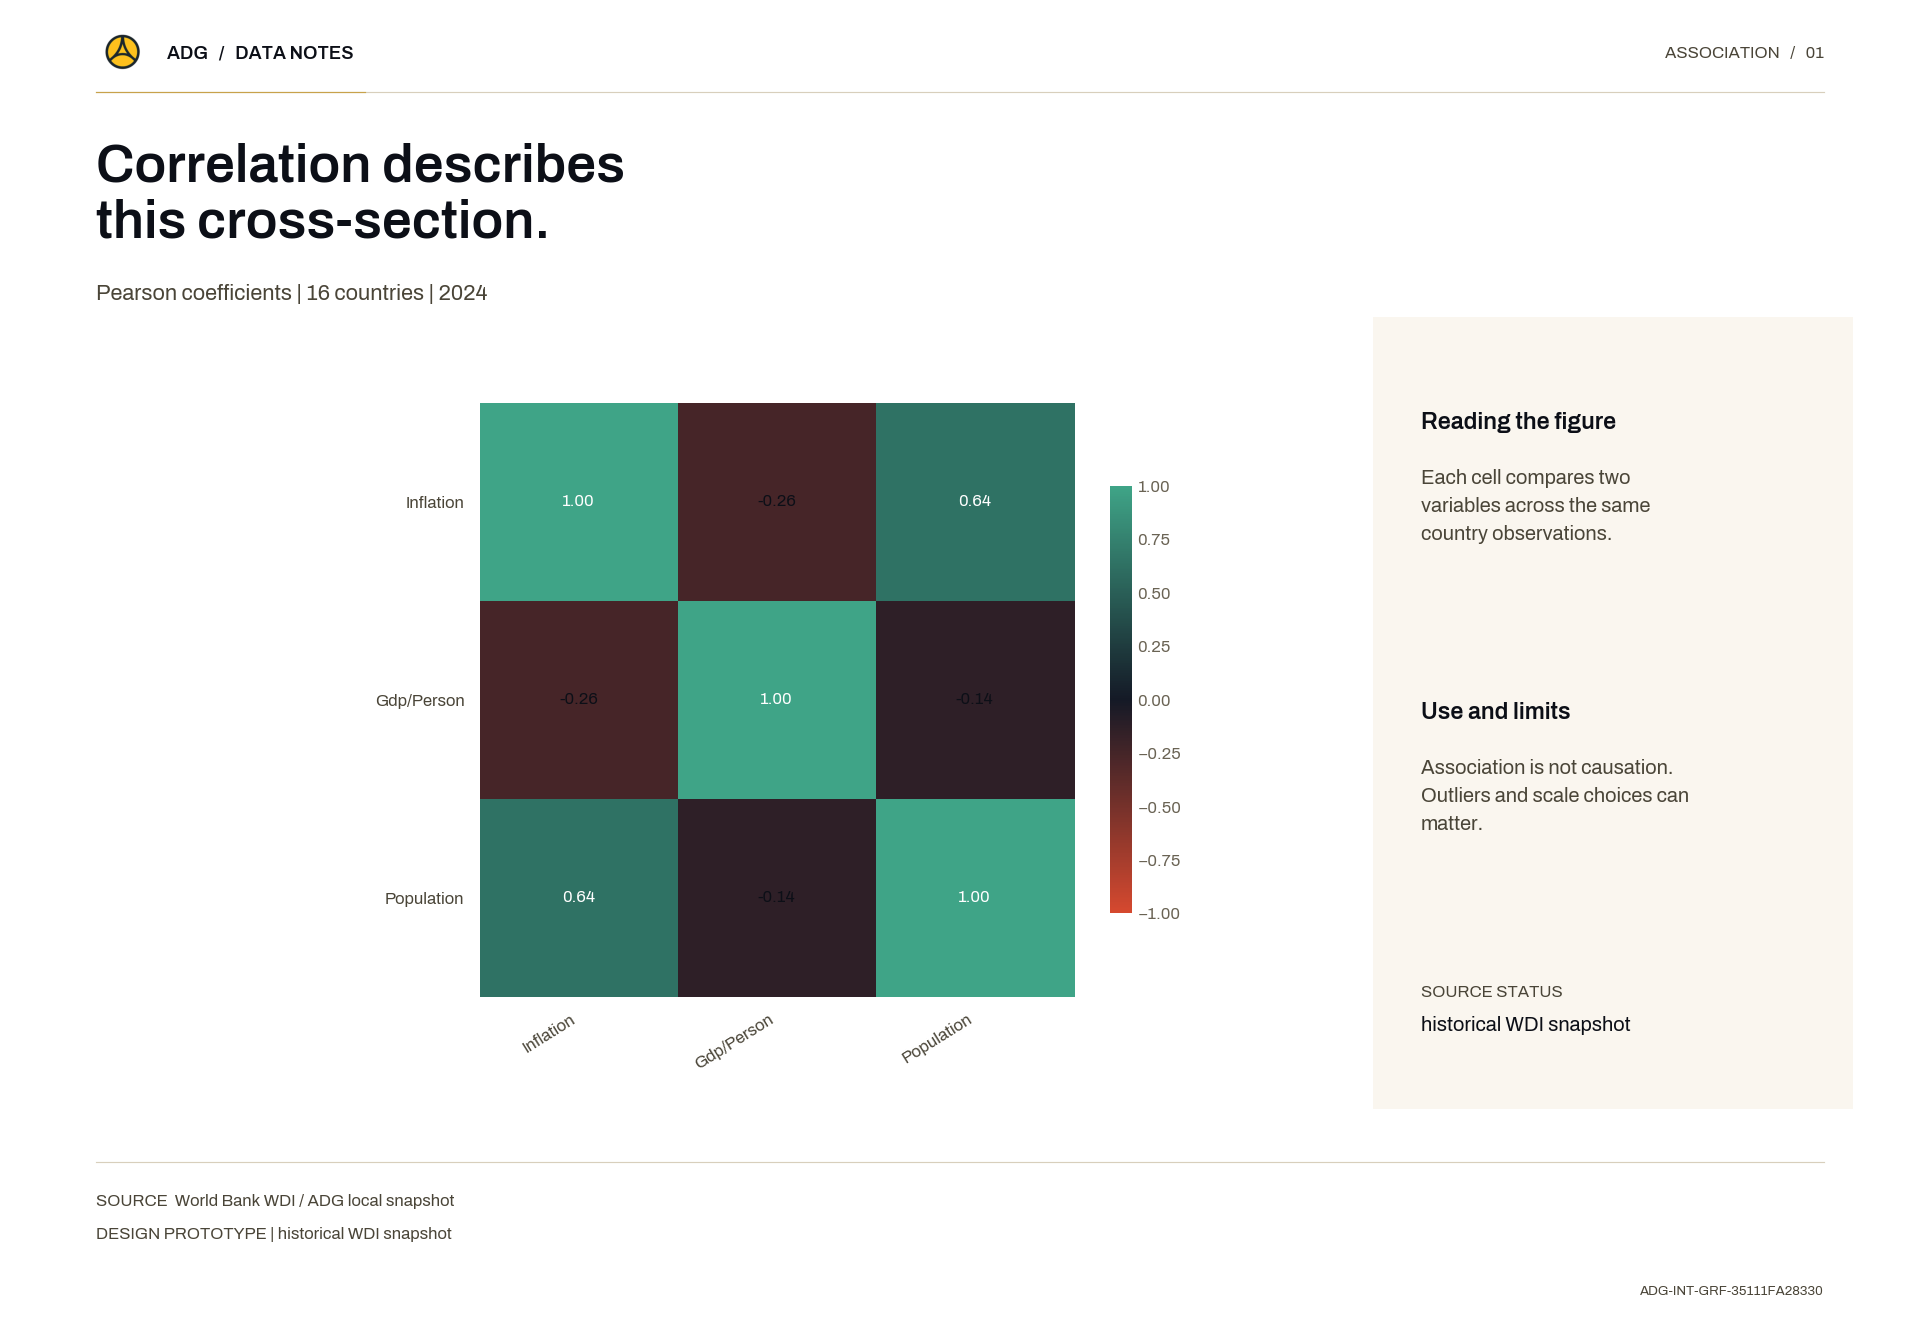
Correlation describes this cross-section.
Each cell compares two variables across the same country observations.Data source: World Bank WDI / ADG local snapshotMethod: Association is not causation. Outliers and scale choices can matter.
Axel Dev Group · Research Repository
Figures built from the library — charts, heat maps, infographics and maps.
35 items
Each cell compares two variables across the same country observations.Data source: World Bank WDI / ADG local snapshotMethod: Association is not causation. Outliers and scale choices can matter.
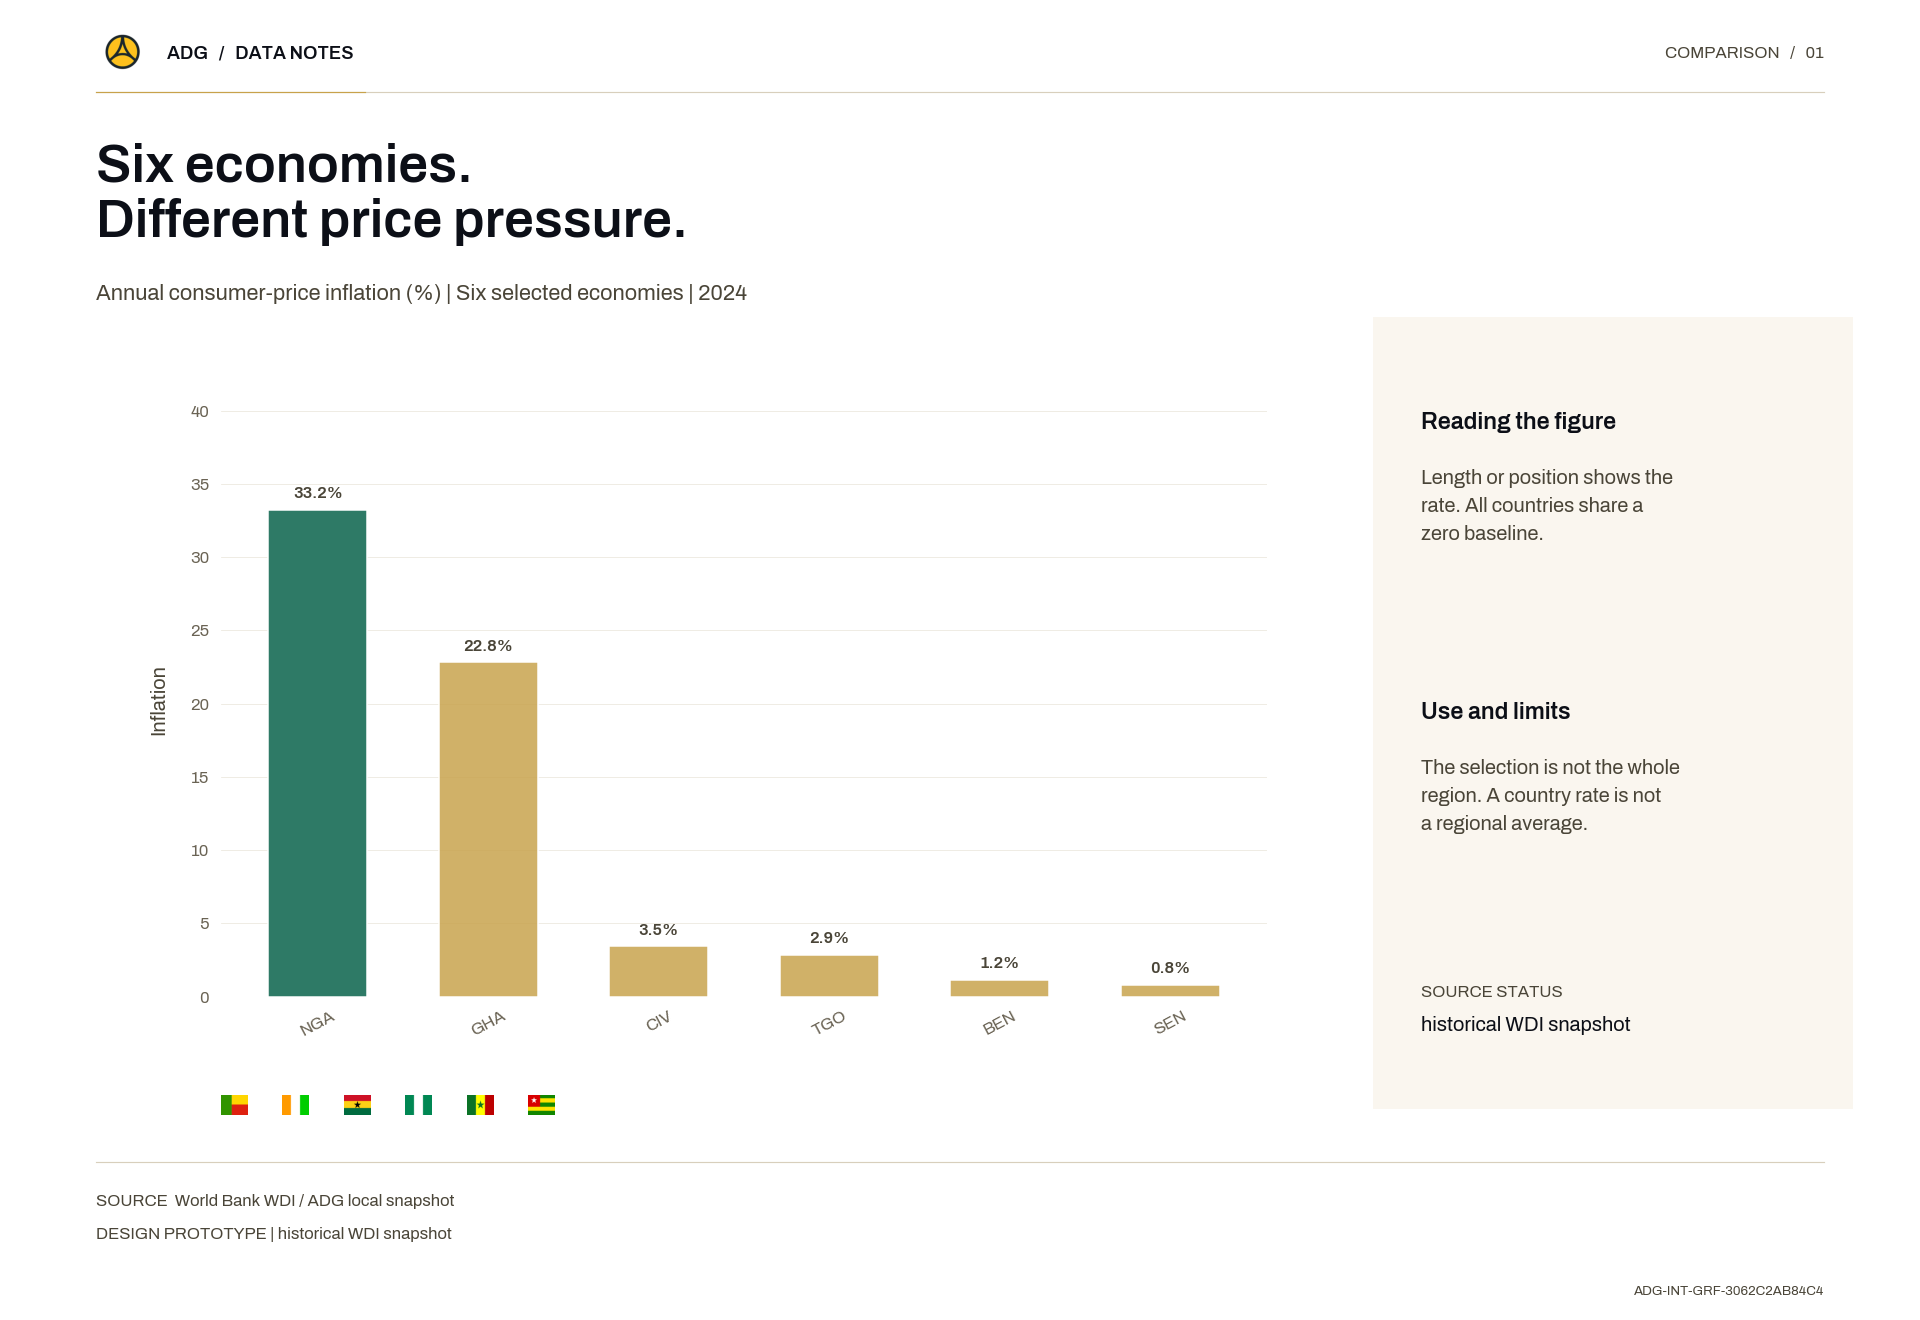
Length or position shows the rate. All countries share a zero baseline.Data source: World Bank WDI / ADG local snapshotMethod: The selection is not the whole region. A country rate is not a regional average.
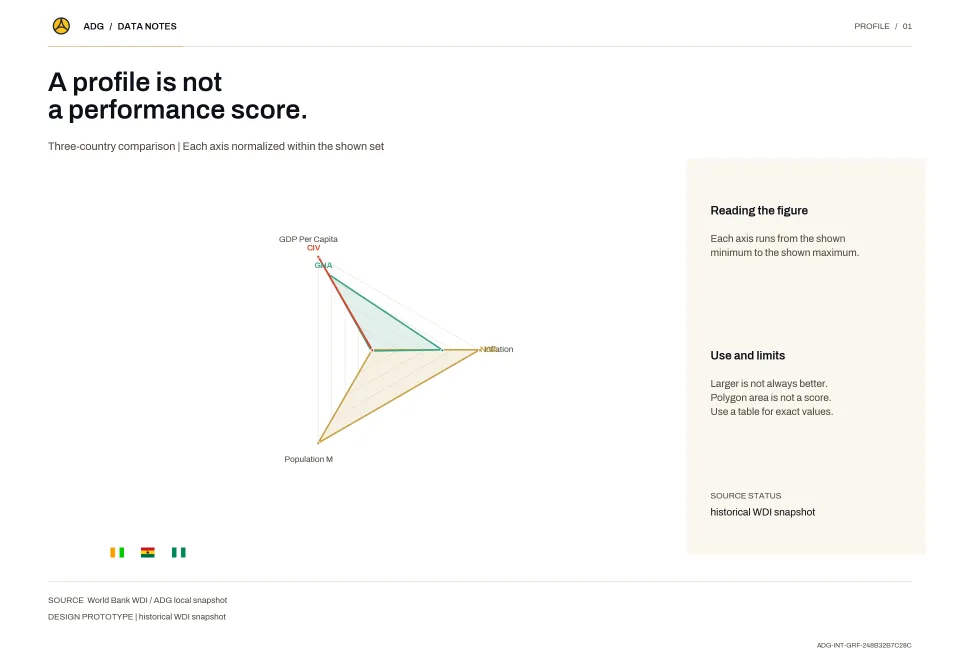
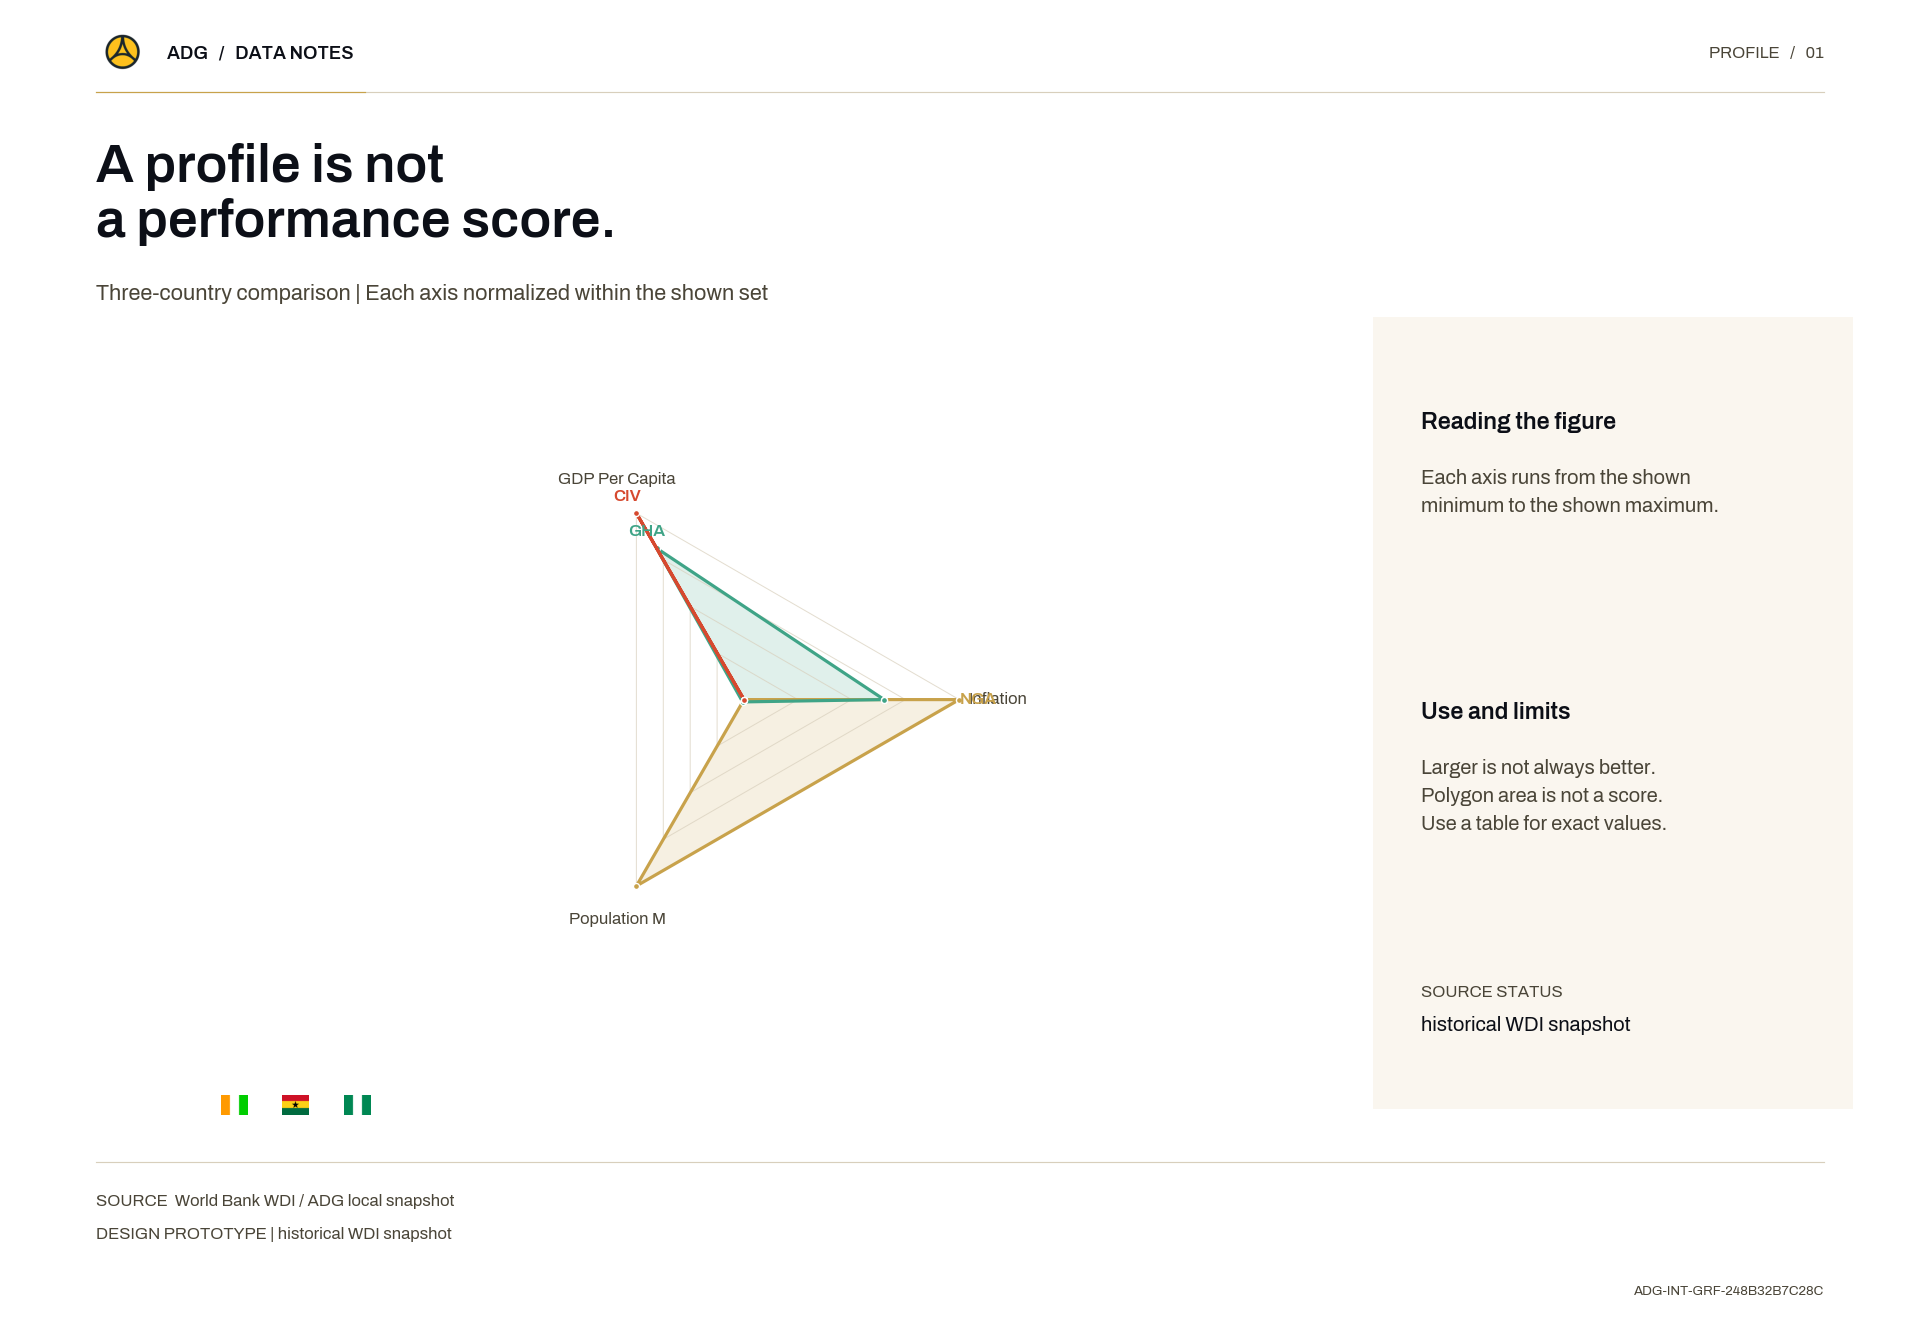
Each axis runs from the shown minimum to the shown maximum.Data source: World Bank WDI / ADG local snapshotMethod: Larger is not always better. Polygon area is not a score. Use a table for exact values.
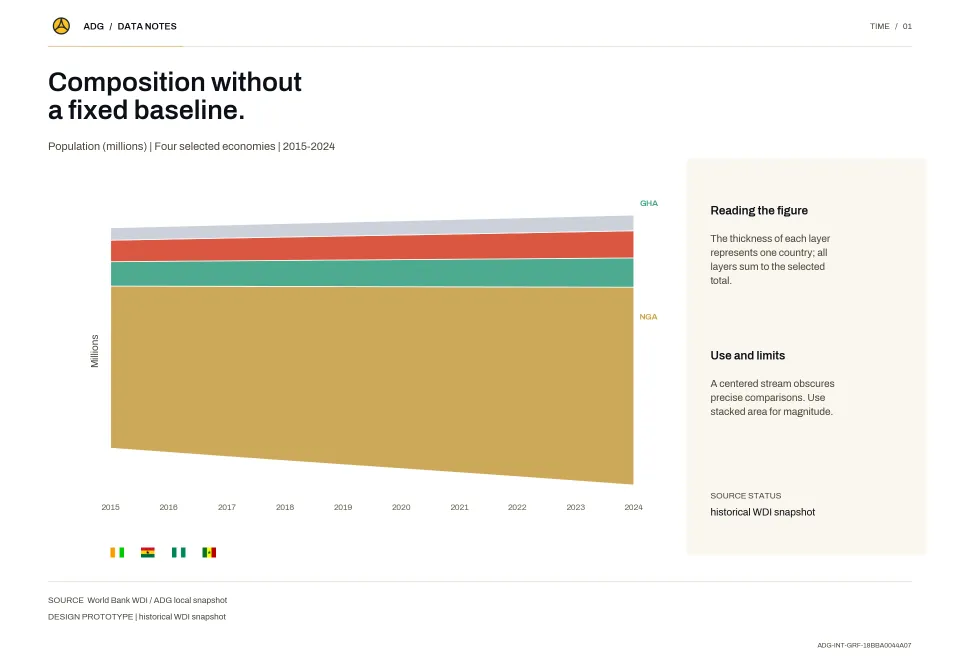
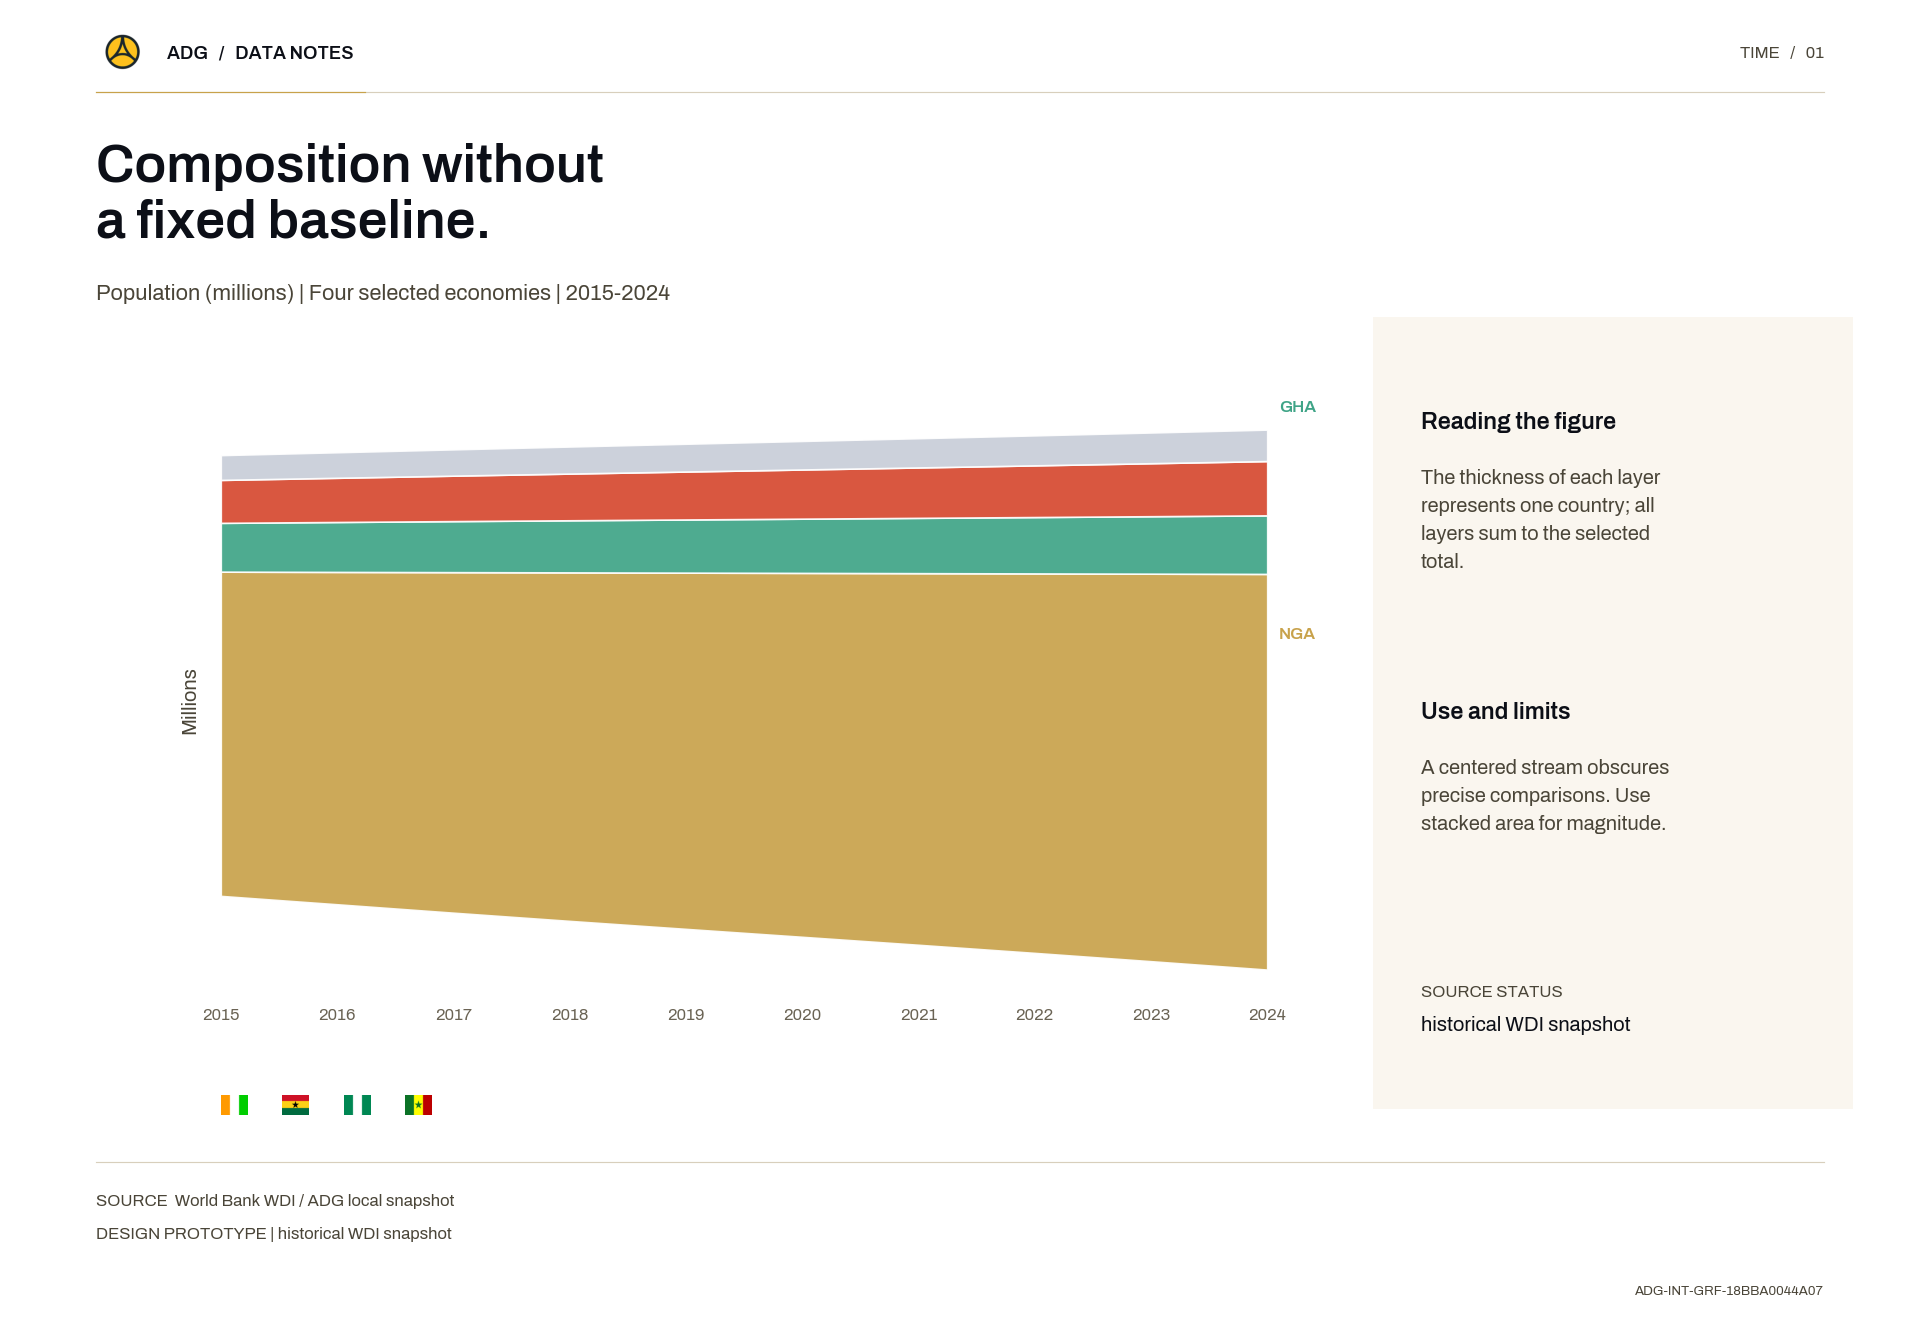
The thickness of each layer represents one country; all layers sum to the selected total.Data source: World Bank WDI / ADG local snapshotMethod: A centered stream obscures precise comparisons. Use stacked area for magnitude.
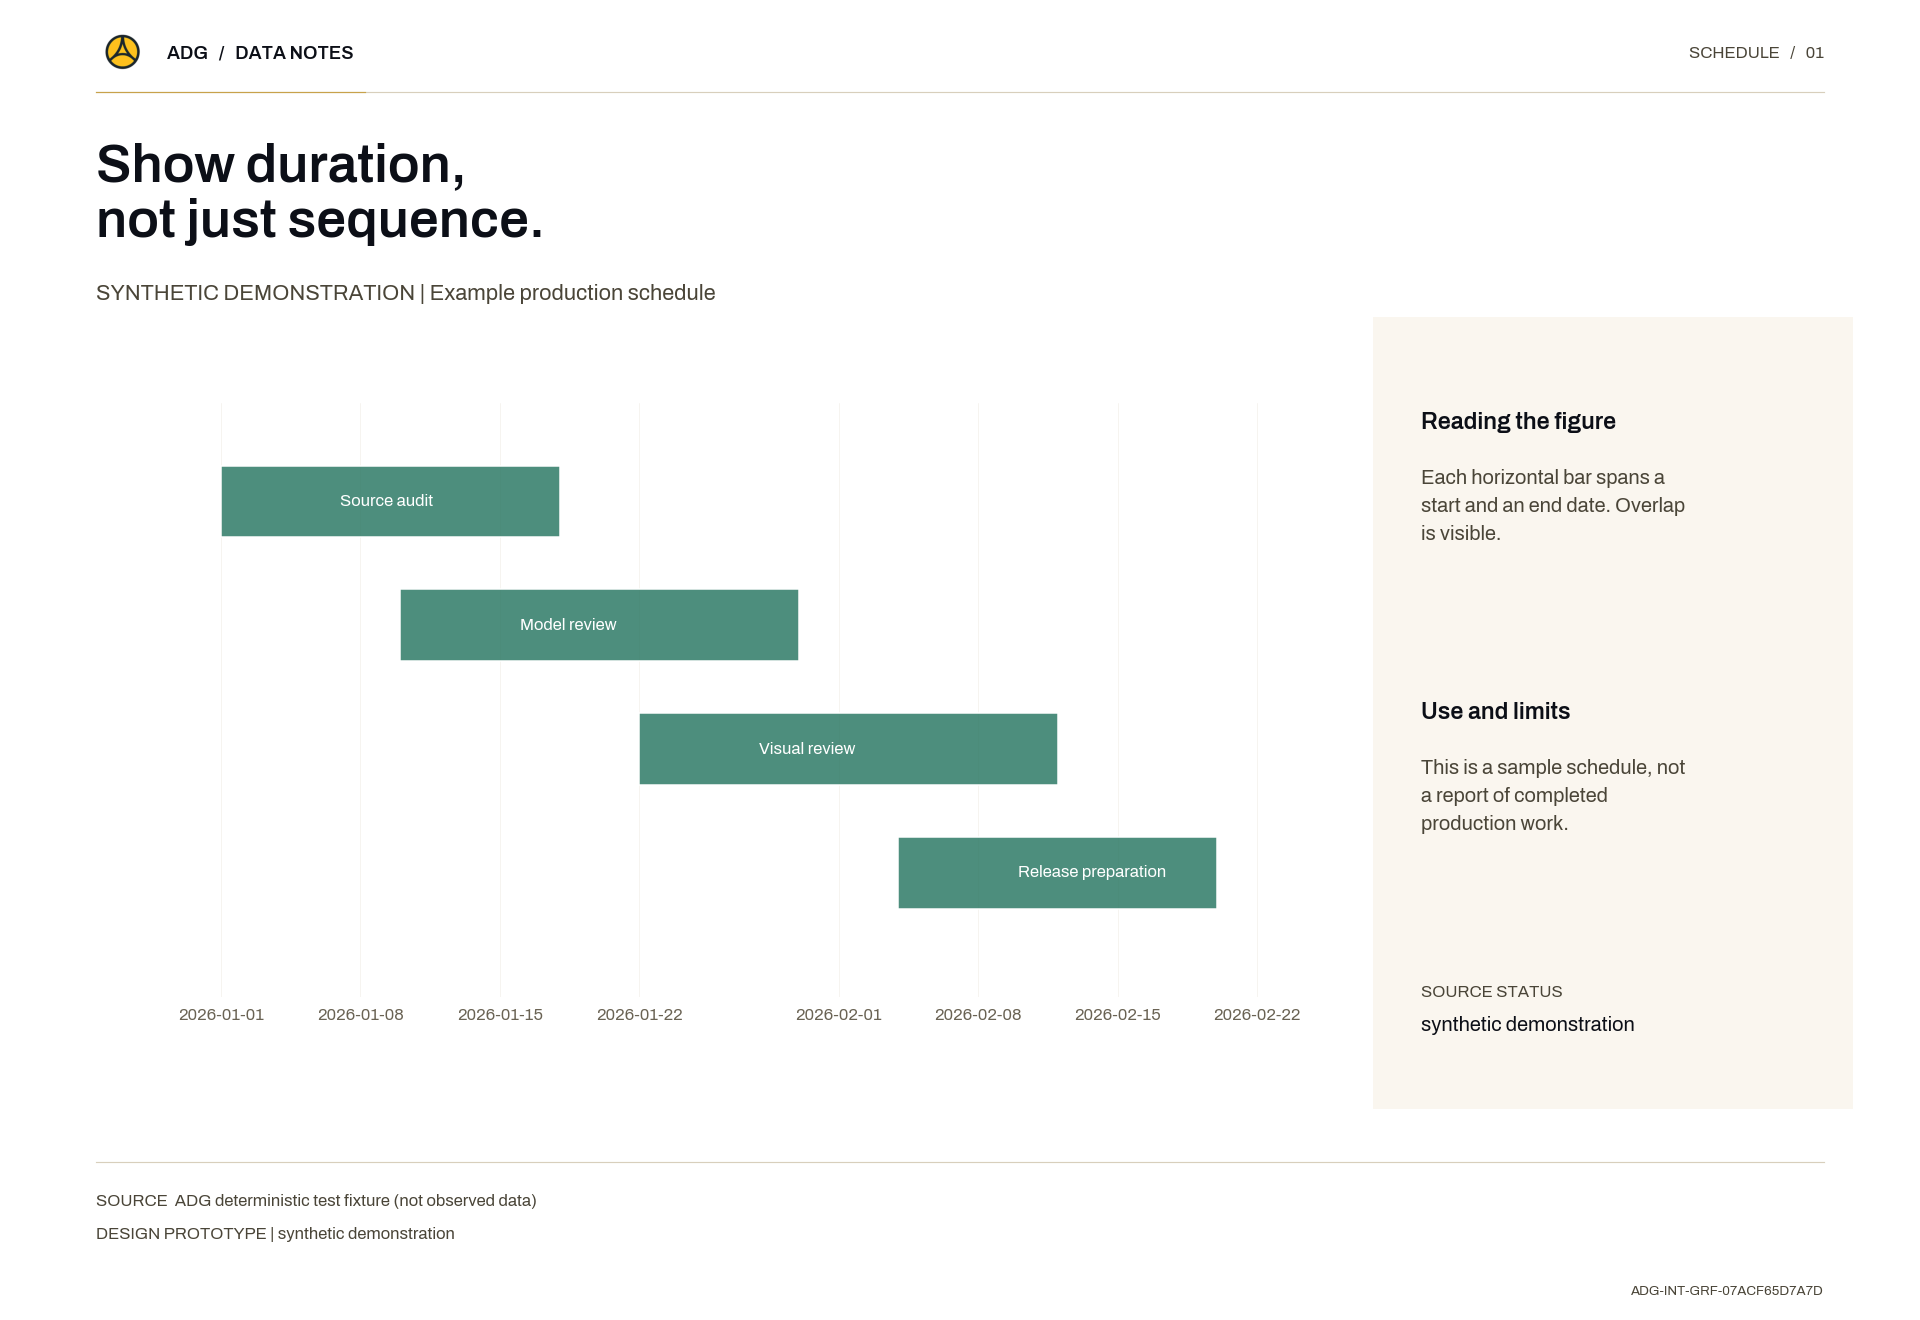
Each horizontal bar spans a start and an end date. Overlap is visible.Data source: ADG deterministic test fixture (not observed data)Method: This is a sample schedule, not a report of completed production work.
No results found
Try adjusting your search or filters.
Sankofa · sahn-KOH-fah
Learn from the past to build the future