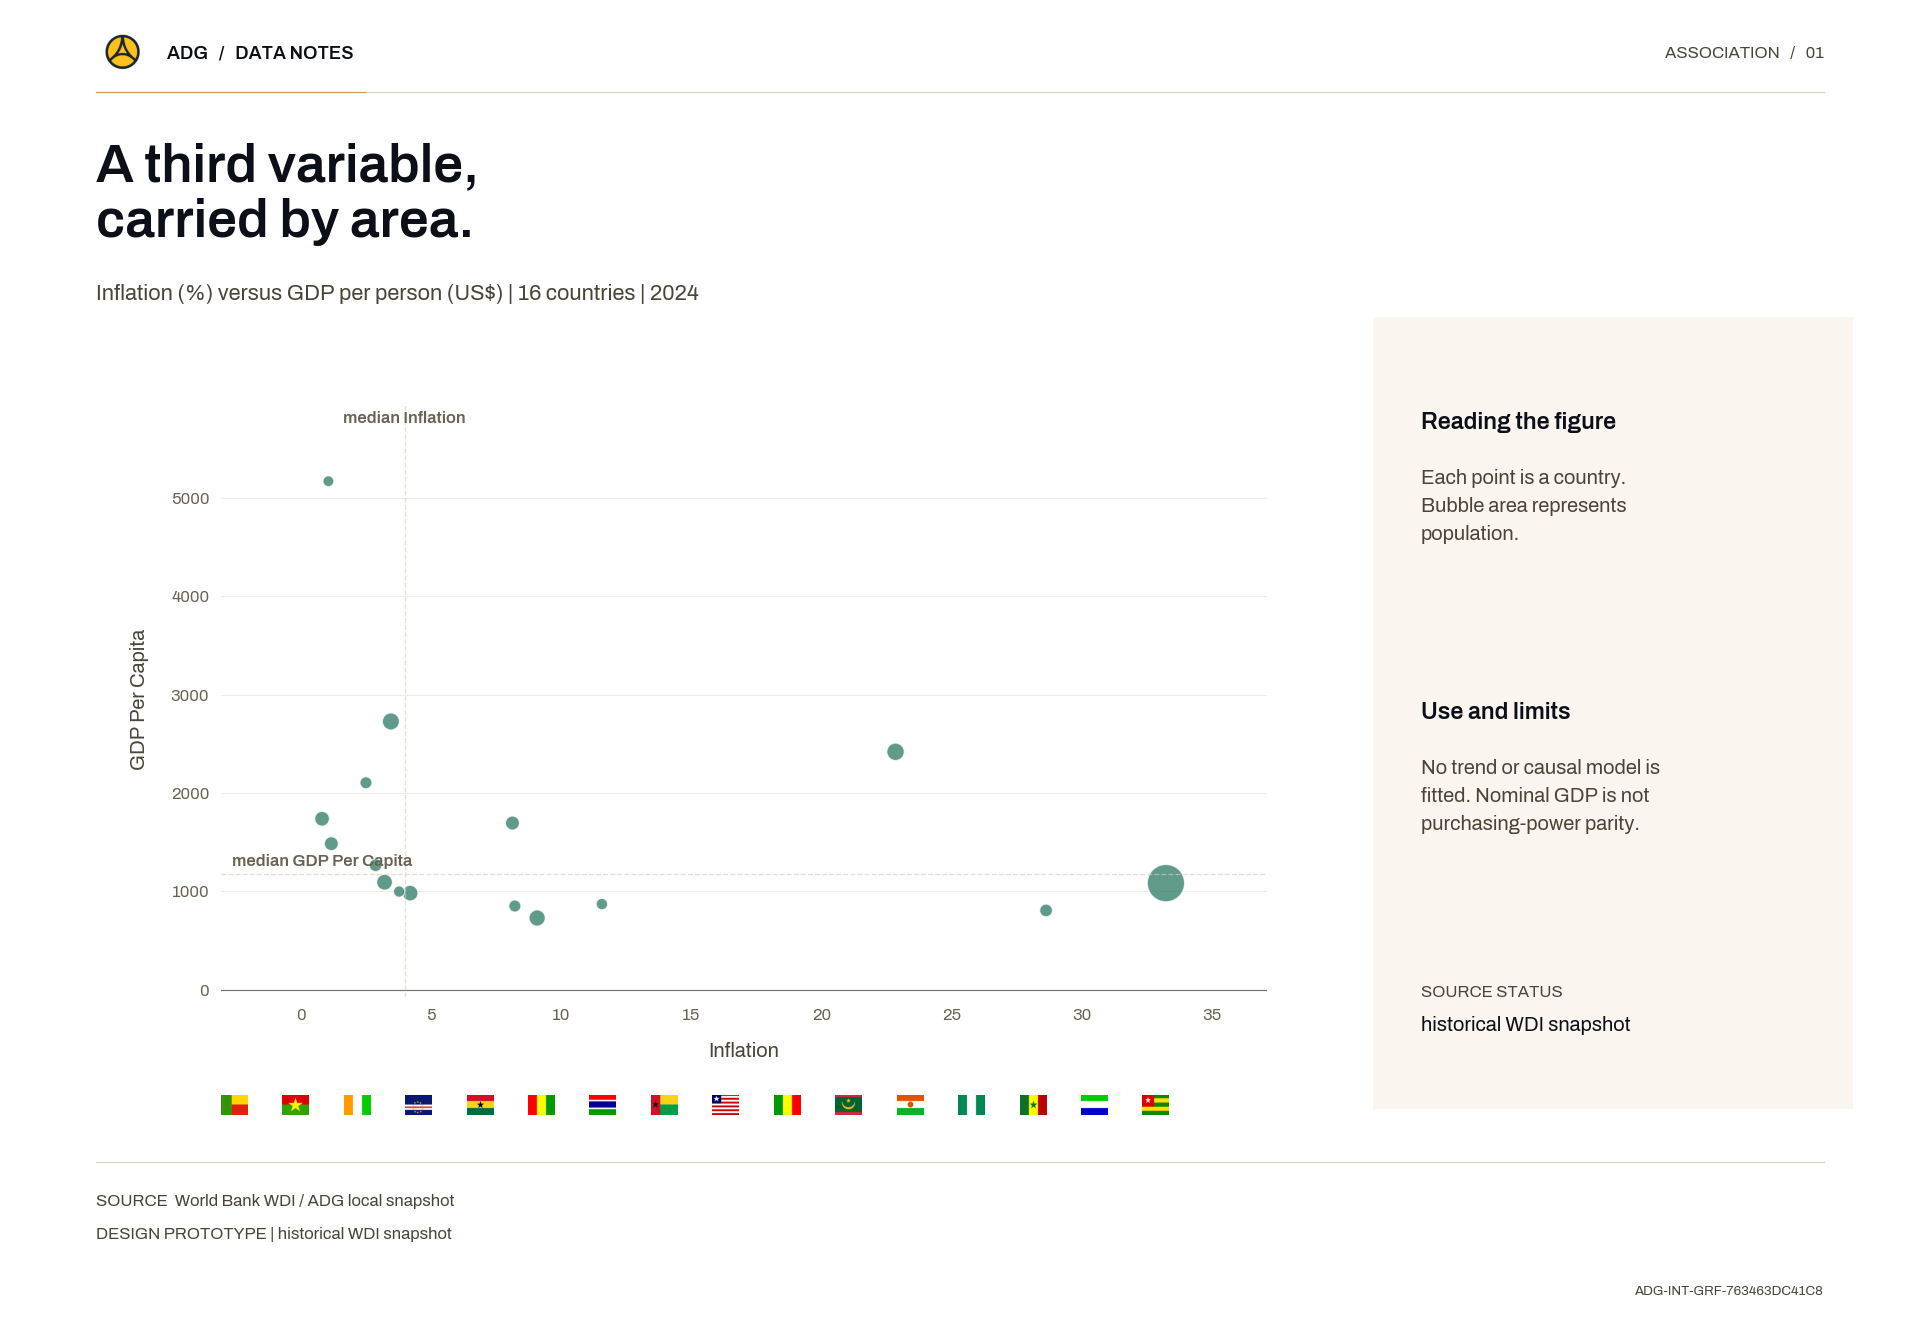
A third variable, carried by area.
Maps Visualization

Une troisième variable, portée par la surface.

Each point is a country. Bubble area represents population.Data source: World Bank WDI / ADG local snapshotMethod: No trend or causal model is fitted. Nominal GDP is not purchasing-power parity.
Description
Chaque point est un pays. La surface de la bulle représente la population.

Each point is a country. Bubble area represents population.

Data source: World Bank WDI / ADG local snapshot

Method: No trend or causal model is fitted. Nominal GDP is not purchasing-power parity.

Publication Date
Visual Type
Thumbnail / Cover Image
A third variable, carried by area.
Methodology
No trend or causal model is fitted. Nominal GDP is not purchasing-power parity.
Track the distance between two years.
Maps Visualization

Suivre l'écart entre deux années.

Each pair links the same country. Position gives the rate in each year.Data source: World Bank WDI / ADG local snapshotMethod: The line does not describe the path between the two observations.

Description
Chaque paire relie un même pays. La position donne le taux de chaque année.

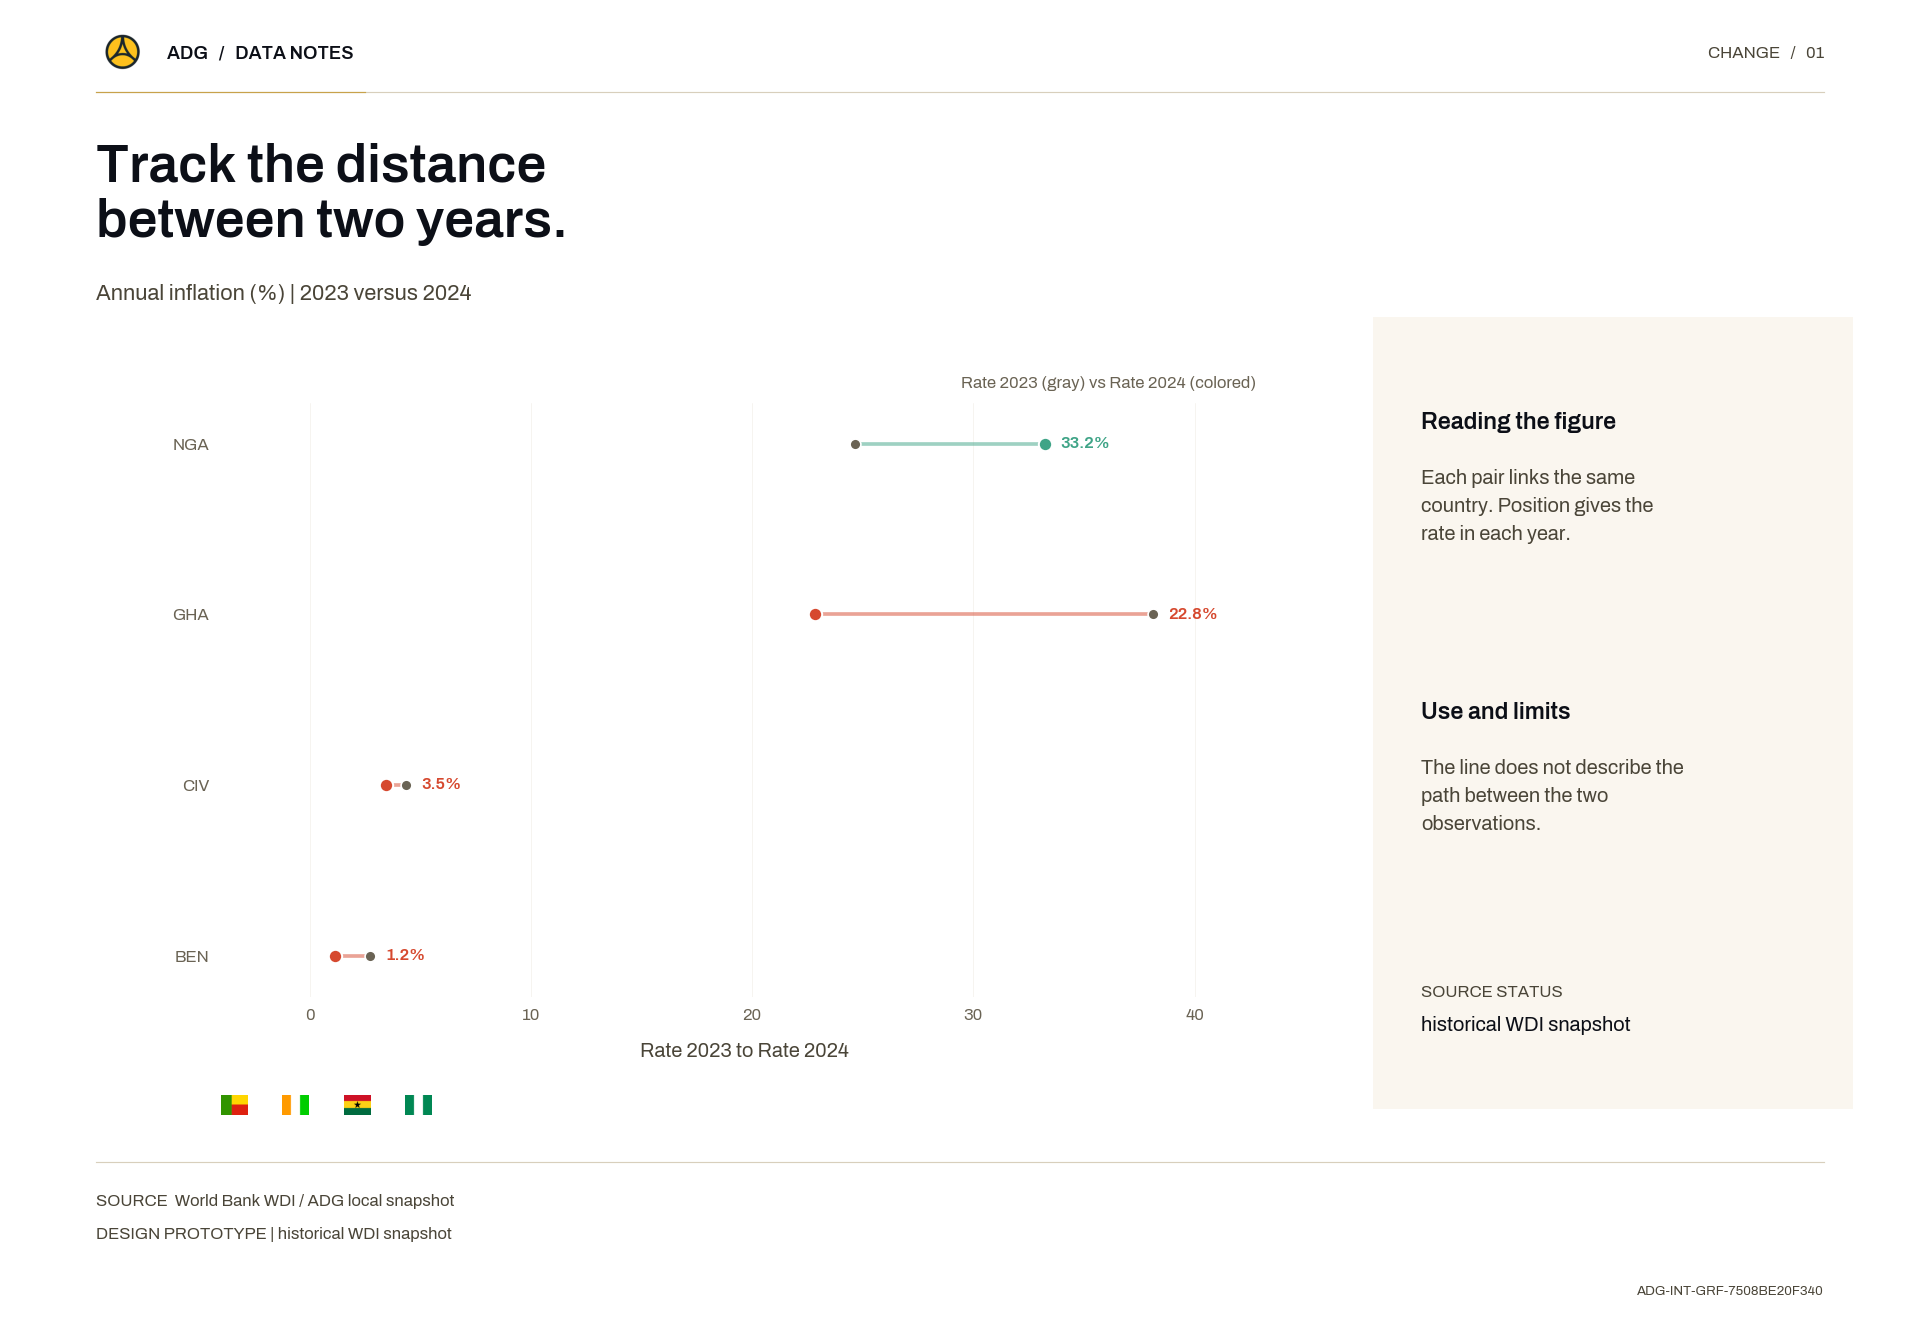
Each pair links the same country. Position gives the rate in each year.

Data source: World Bank WDI / ADG local snapshot

Method: The line does not describe the path between the two observations.

Publication Date
Visual Type
Thumbnail / Cover Image
Track the distance between two years.
Methodology
The line does not describe the path between the two observations.
Two variables. Sixteen positions.
Maps Visualization

Deux variables. Seize positions.

Each point is a country. All markers are equal in size.Data source: World Bank WDI / ADG local snapshotMethod: No trend or causal model is fitted. Nominal GDP is not purchasing-power parity.
Description
Chaque point est un pays. Tous les marqueurs sont de taille identique.

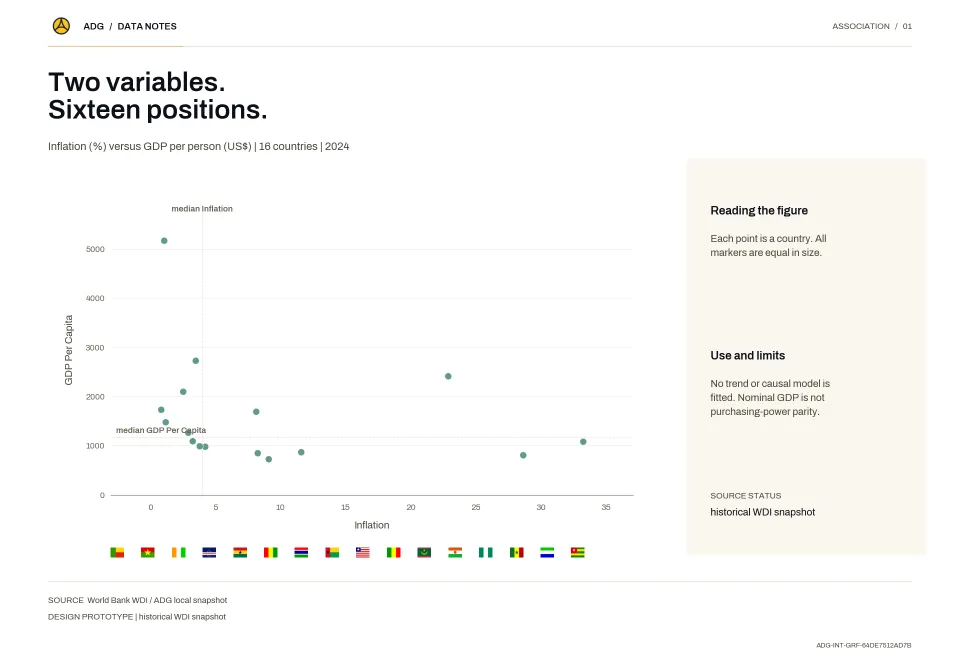
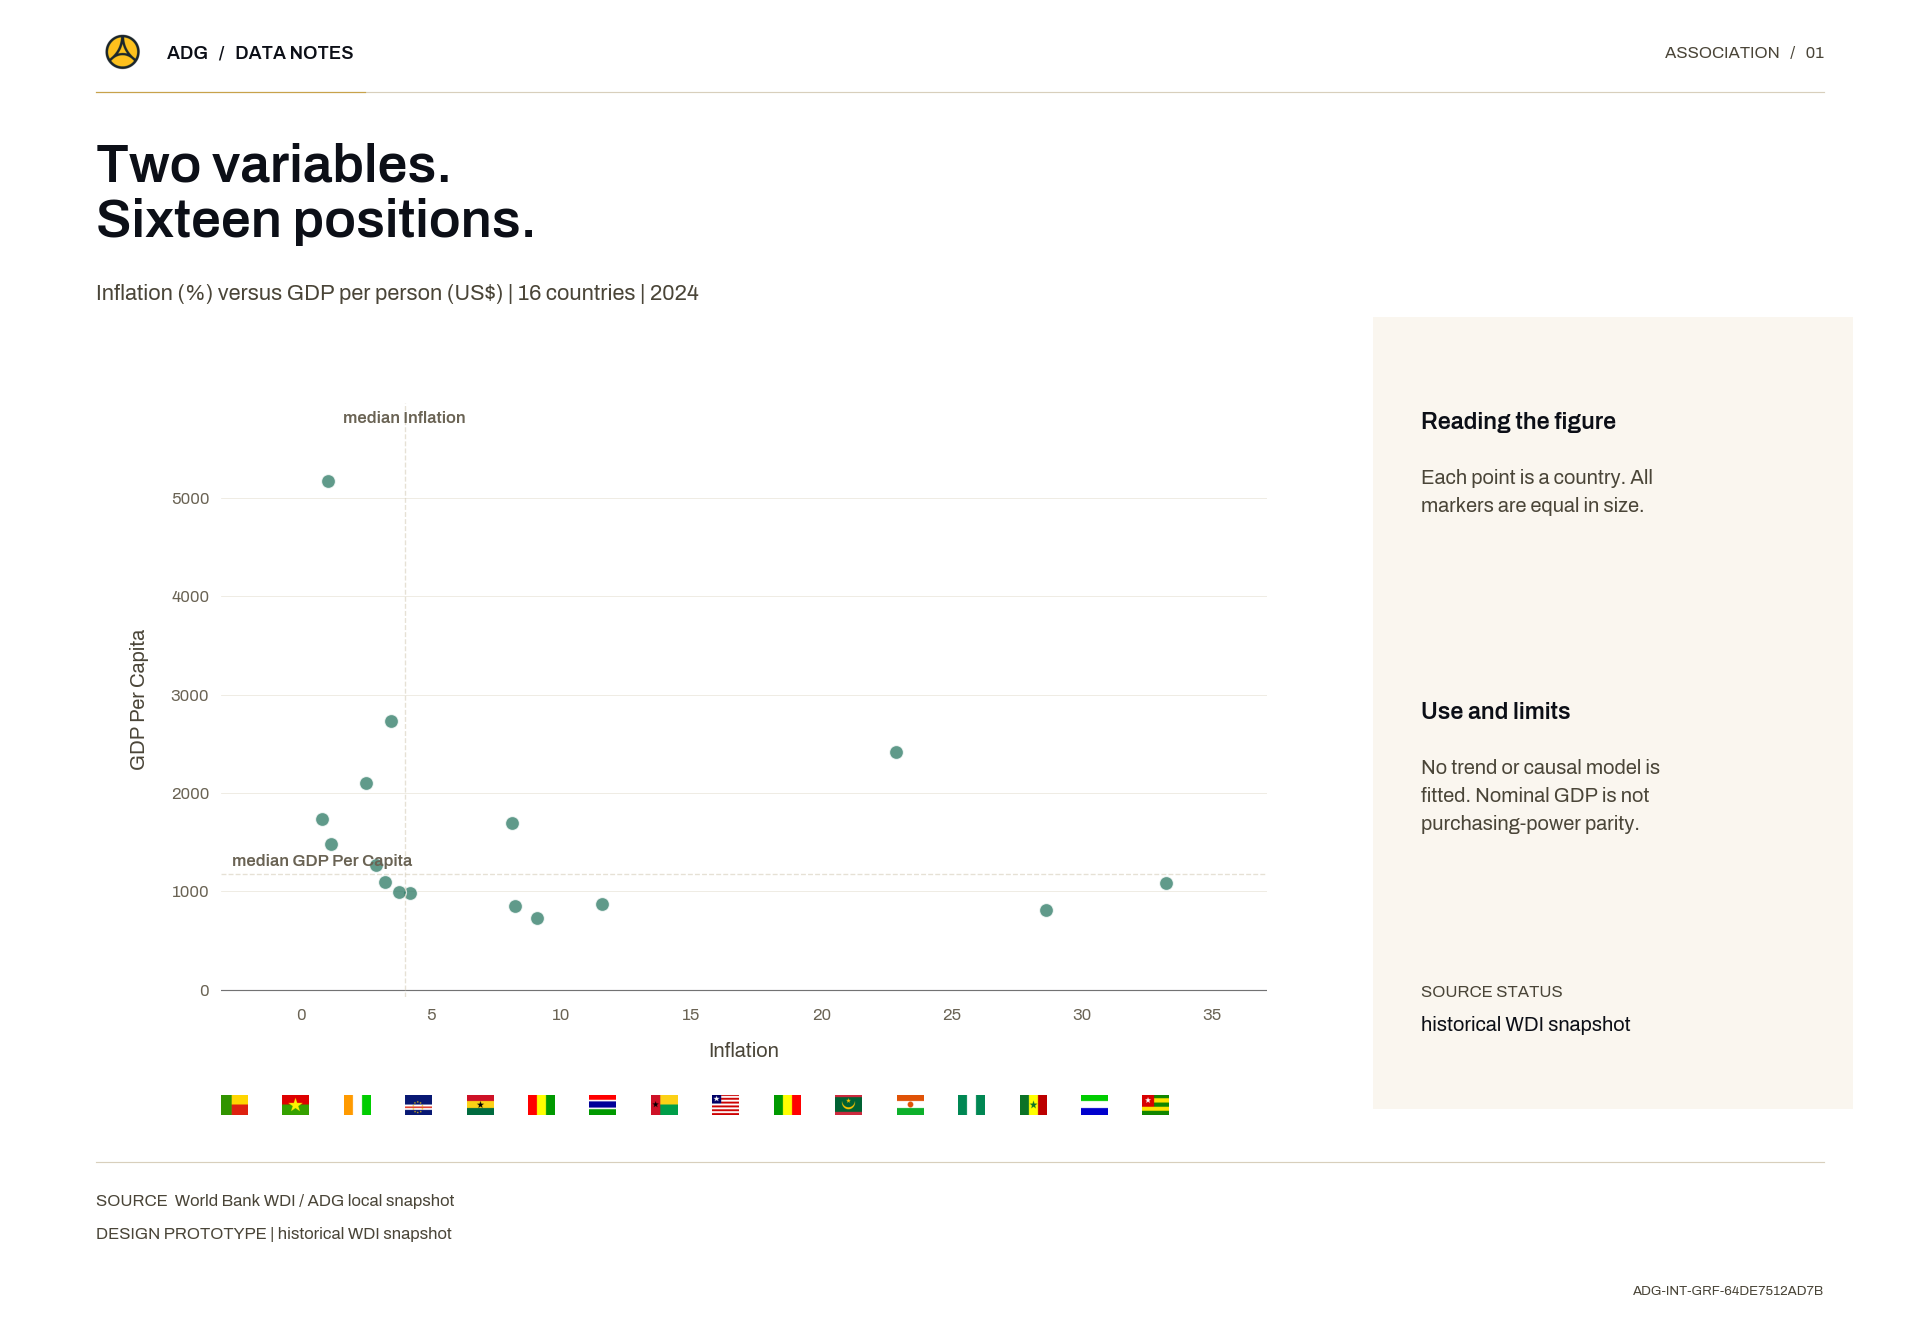
Each point is a country. All markers are equal in size.

Data source: World Bank WDI / ADG local snapshot

Method: No trend or causal model is fitted. Nominal GDP is not purchasing-power parity.
Publication Date
Visual Type
Thumbnail / Cover Image
Two variables. Sixteen positions.
Methodology
No trend or causal model is fitted. Nominal GDP is not purchasing-power parity.
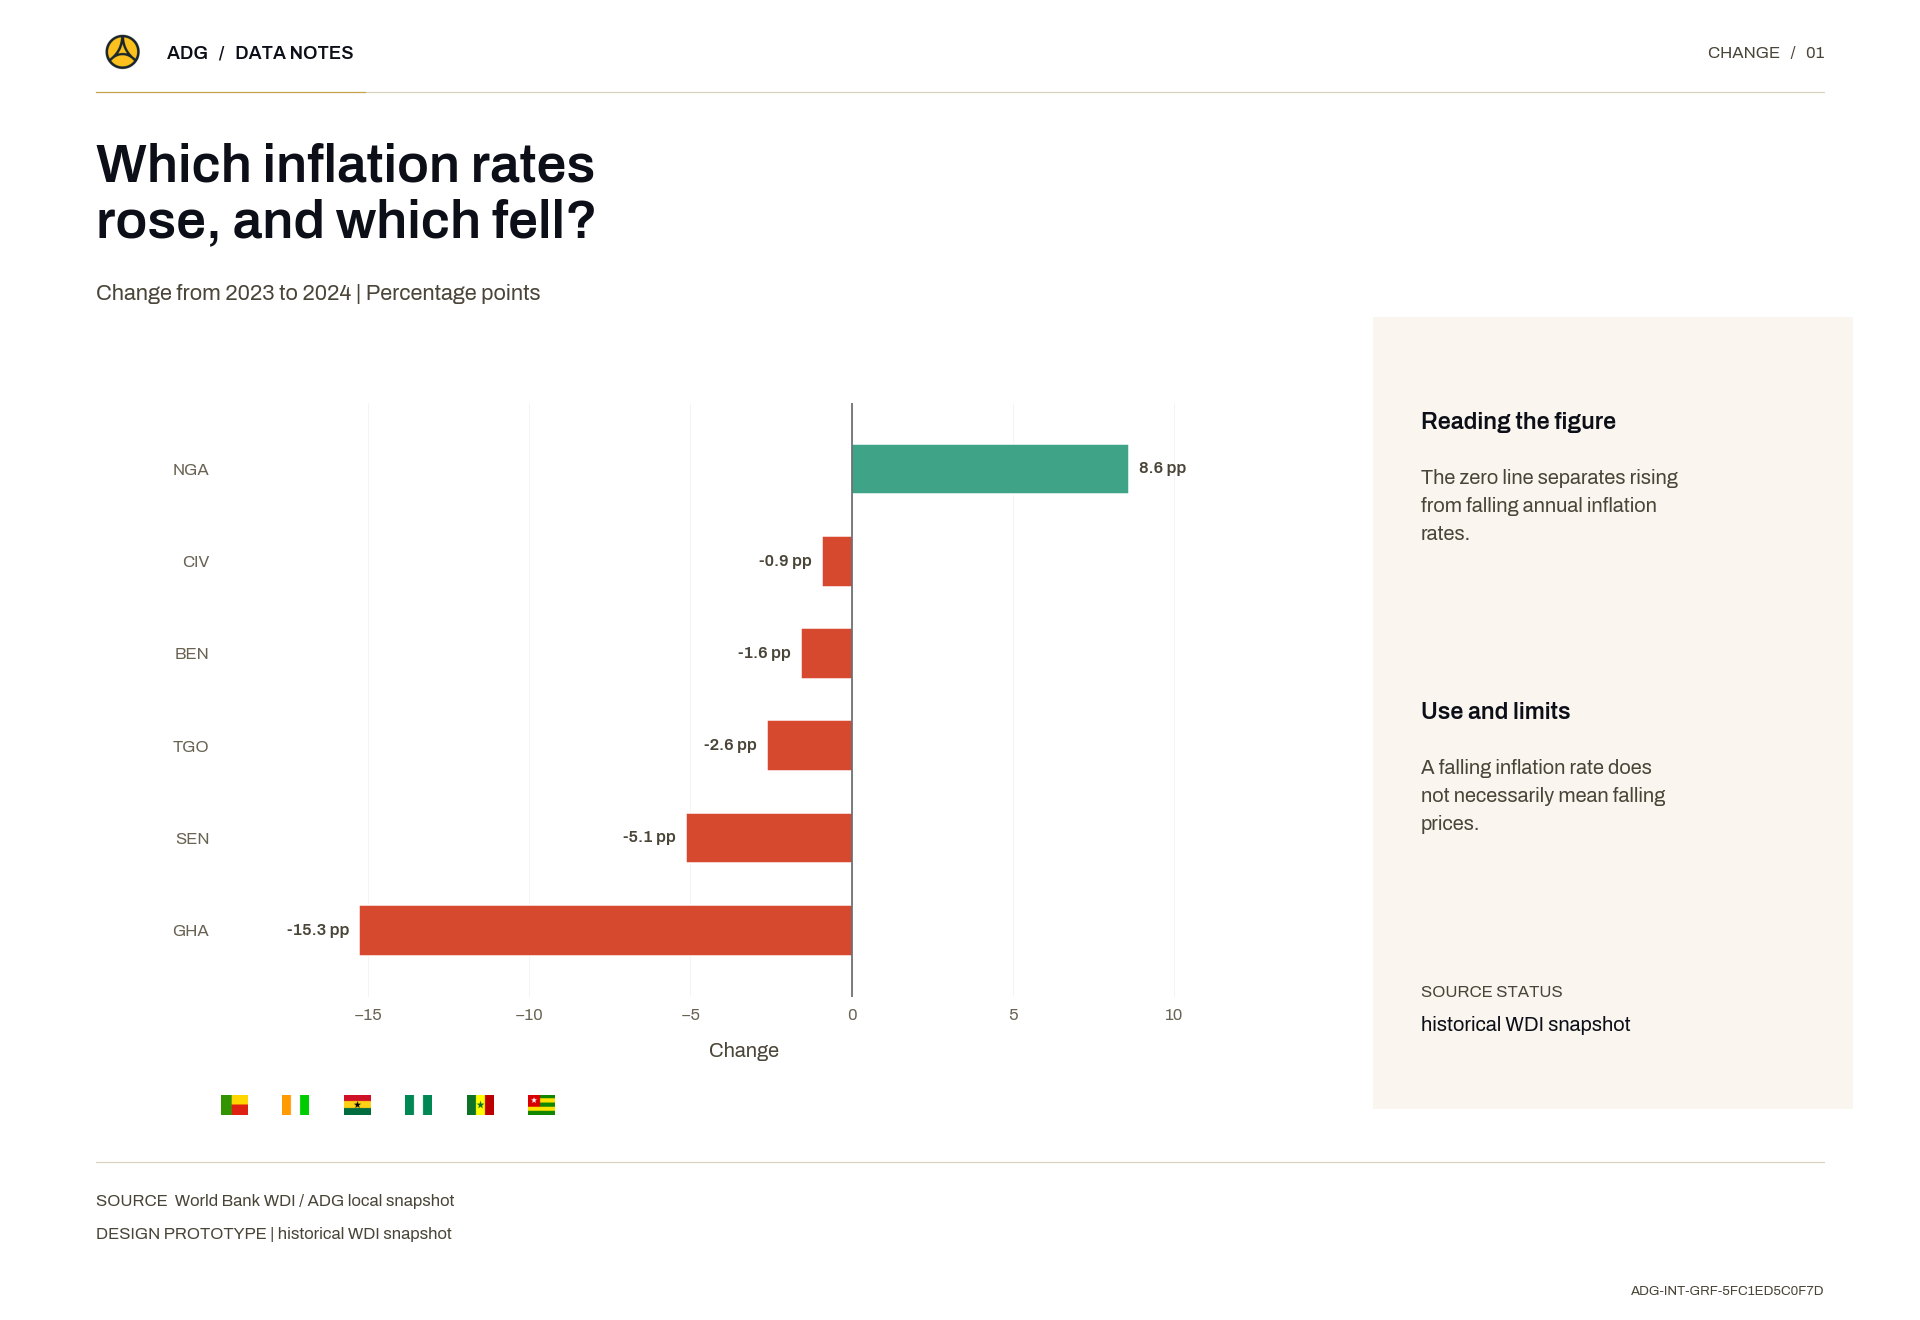
Which inflation rates rose, and which fell?
Maps Visualization

Quels taux d'inflation ont monté, lesquels ont baissé ?

The zero line separates rising from falling annual inflation rates.Data source: World Bank WDI / ADG local snapshotMethod: A falling inflation rate does not necessarily mean falling prices.

Description
La ligne du zéro sépare les taux d'inflation annuels en hausse de ceux en baisse.

The zero line separates rising from falling annual inflation rates.

Data source: World Bank WDI / ADG local snapshot

Method: A falling inflation rate does not necessarily mean falling prices.

Publication Date
Visual Type
Thumbnail / Cover Image
Which inflation rates rose, and which fell?
Methodology
A falling inflation rate does not necessarily mean falling prices.
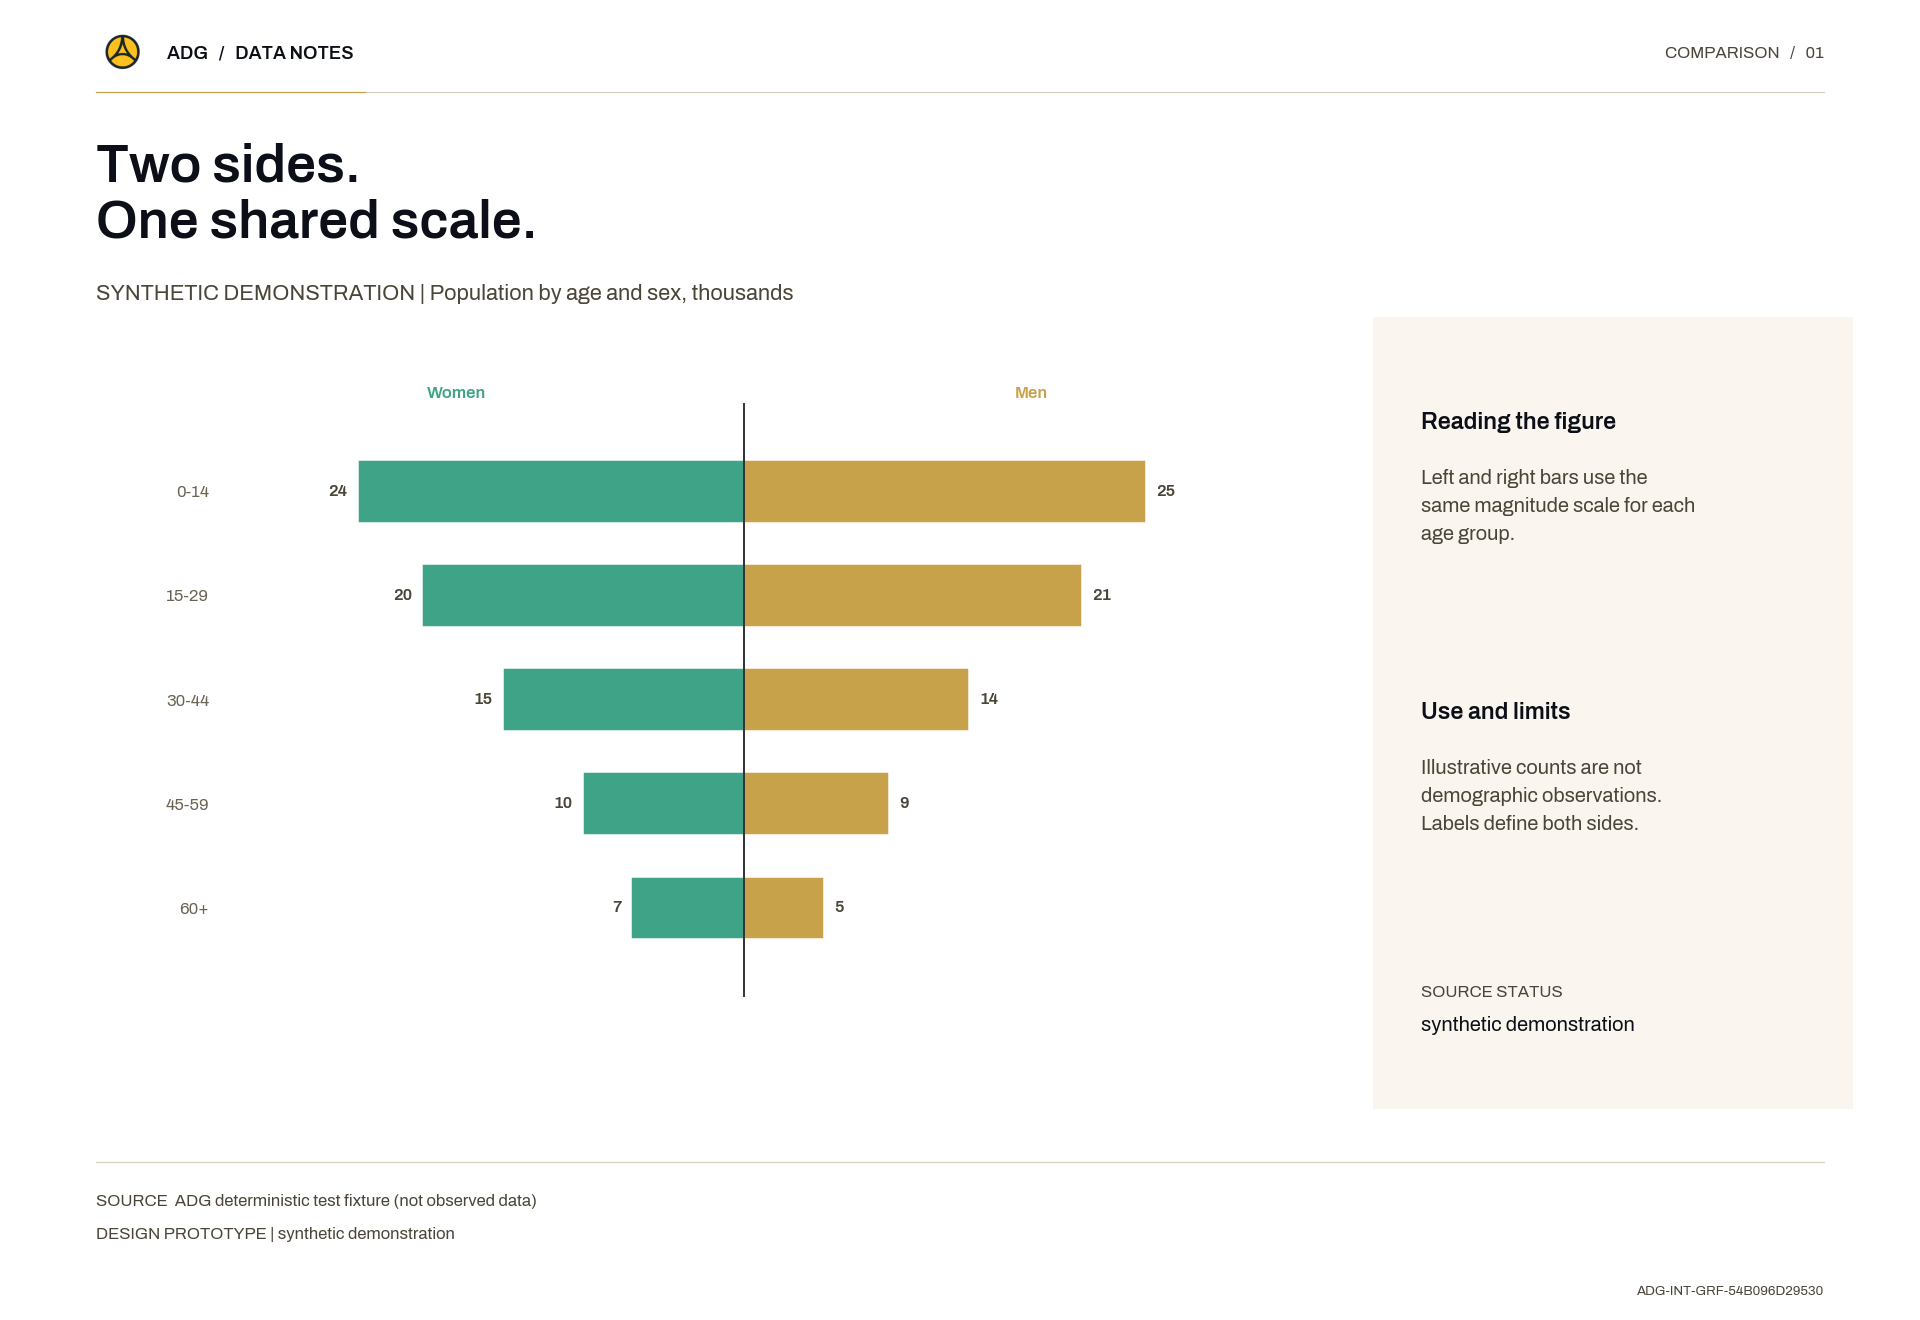
Two sides. One shared scale.
Maps Visualization

Deux côtés. Une seule échelle.

Left and right bars use the same magnitude scale for each age group.Data source: ADG deterministic test fixture (not observed data)Method: Illustrative counts are not demographic observations. Labels define both sides.

Description
Les barres de gauche et de droite utilisent la même échelle de grandeur pour chaque tranche d'âge.

Left and right bars use the same magnitude scale for each age group.

Data source: ADG deterministic test fixture (not observed data)

Method: Illustrative counts are not demographic observations. Labels define both sides.

Publication Date
Visual Type
Thumbnail / Cover Image
Two sides. One shared scale.
Methodology
Illustrative counts are not demographic observations. Labels define both sides.
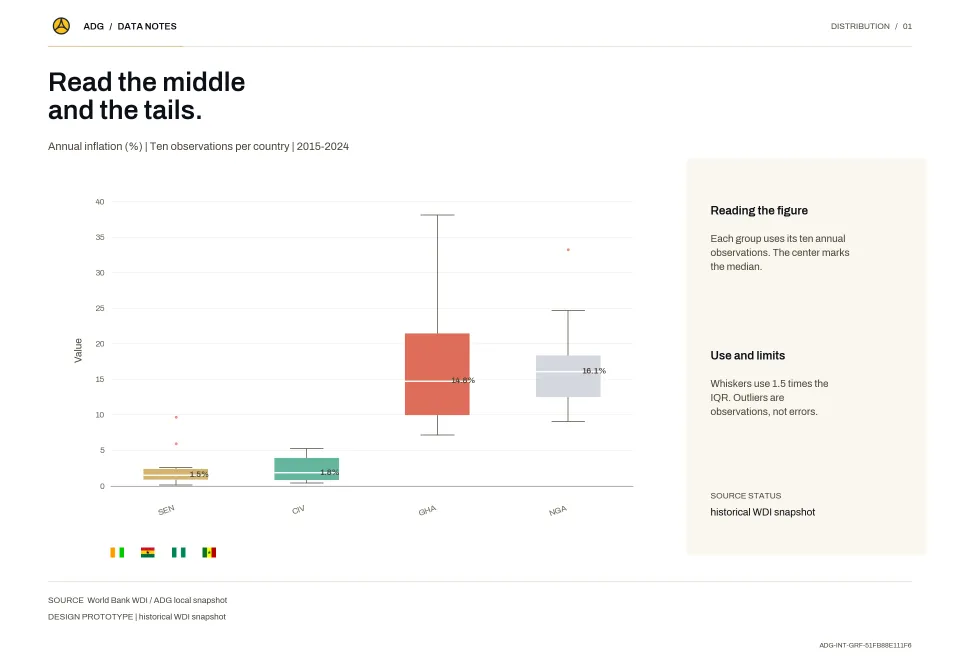
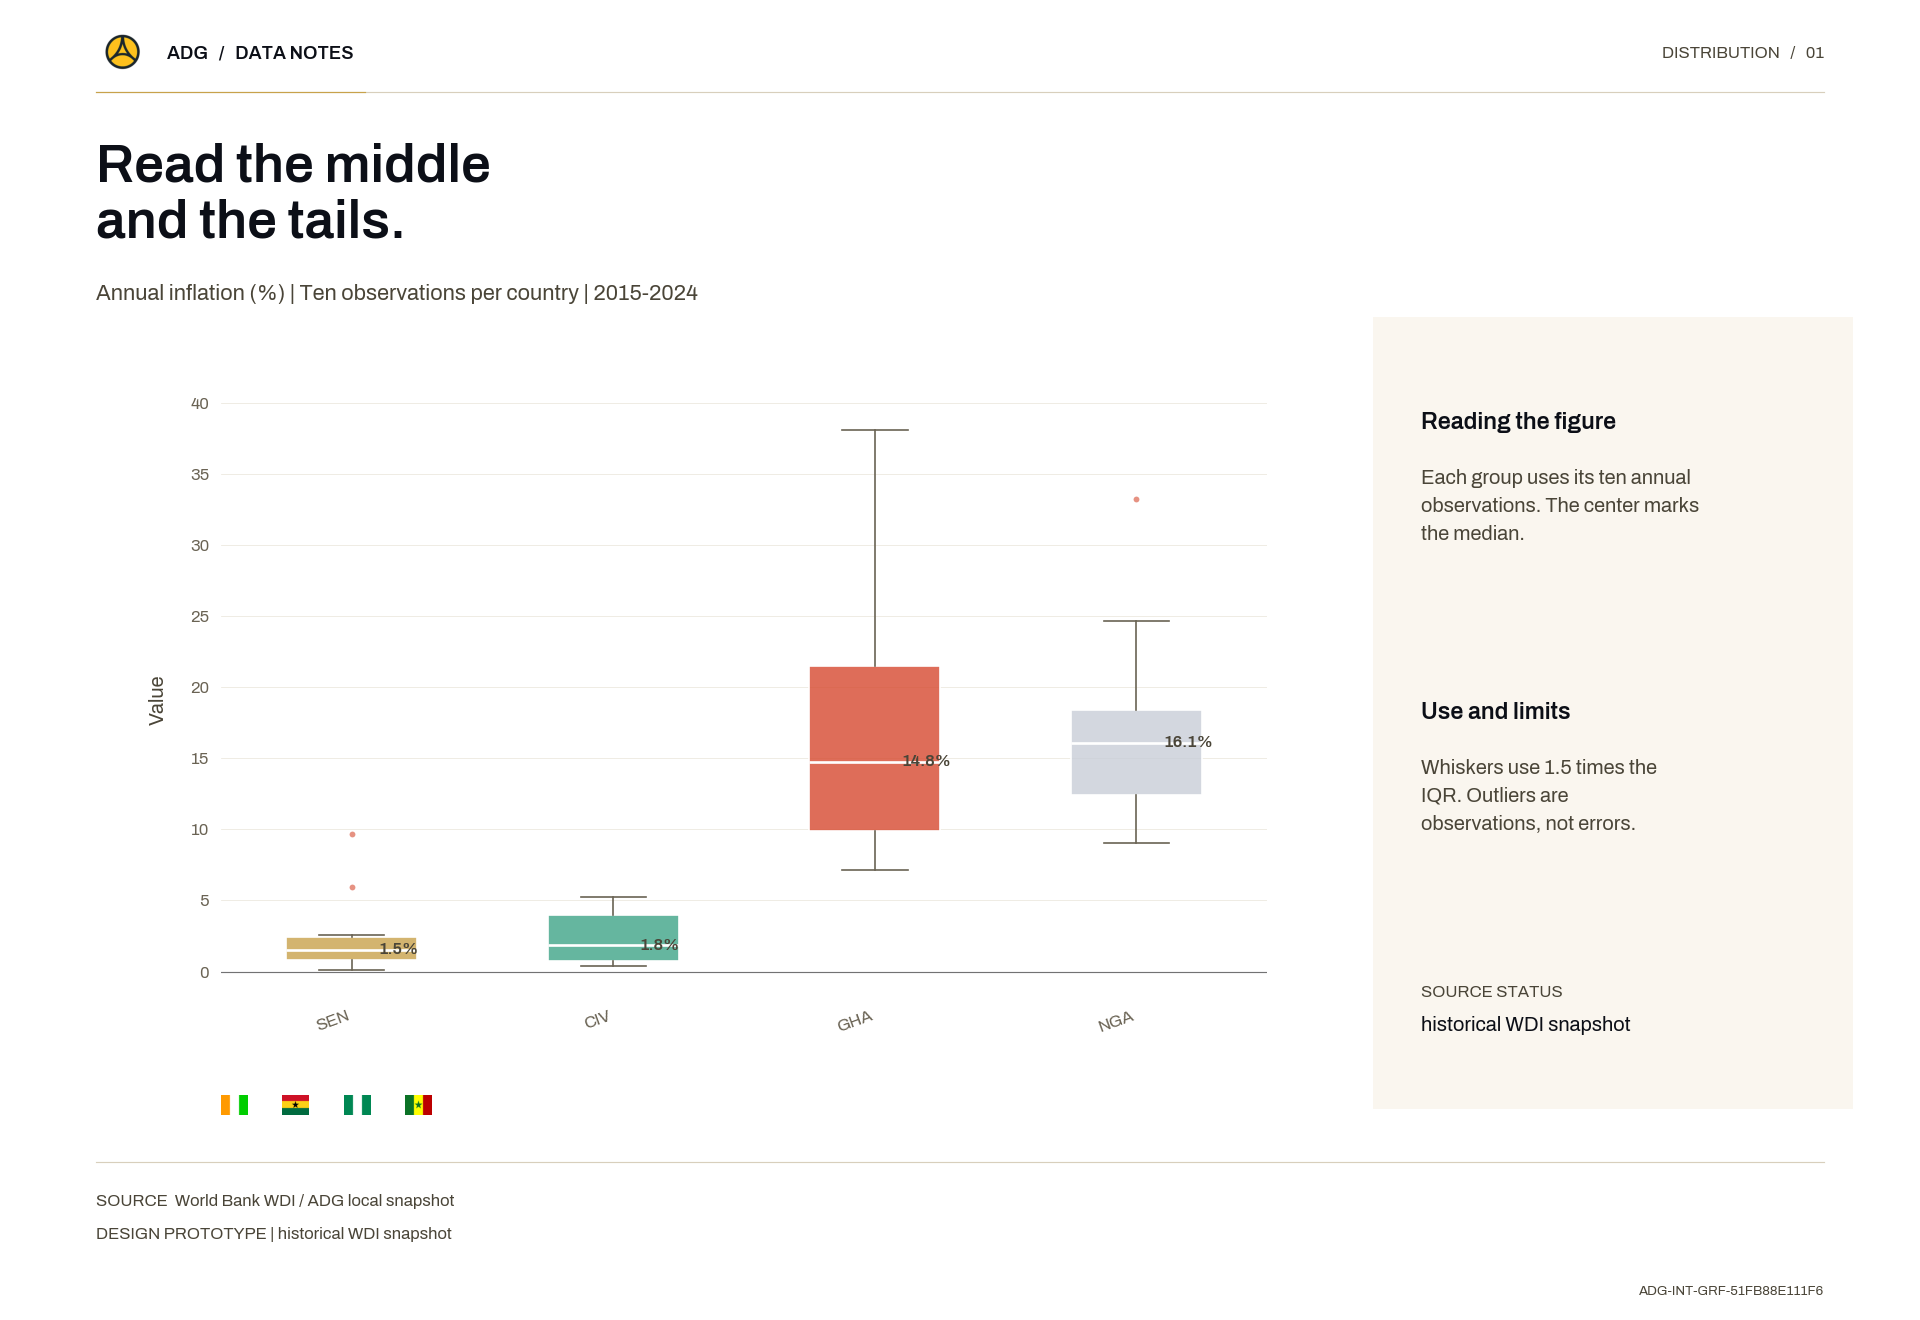
Read the middle and the tails.
Maps Visualization

Lire le centre et les extrémités.

Each group uses its ten annual observations. The center marks the median.Data source: World Bank WDI / ADG local snapshotMethod: Whiskers use 1.5 times the IQR. Outliers are observations, not errors.

Description
Chaque groupe utilise ses dix observations annuelles. Le centre marque la médiane.

Each group uses its ten annual observations. The center marks the median.

Data source: World Bank WDI / ADG local snapshot

Method: Whiskers use 1.5 times the IQR. Outliers are observations, not errors.

Publication Date
Visual Type
Thumbnail / Cover Image
Read the middle and the tails.
Methodology
Whiskers use 1.5 times the IQR. Outliers are observations, not errors.
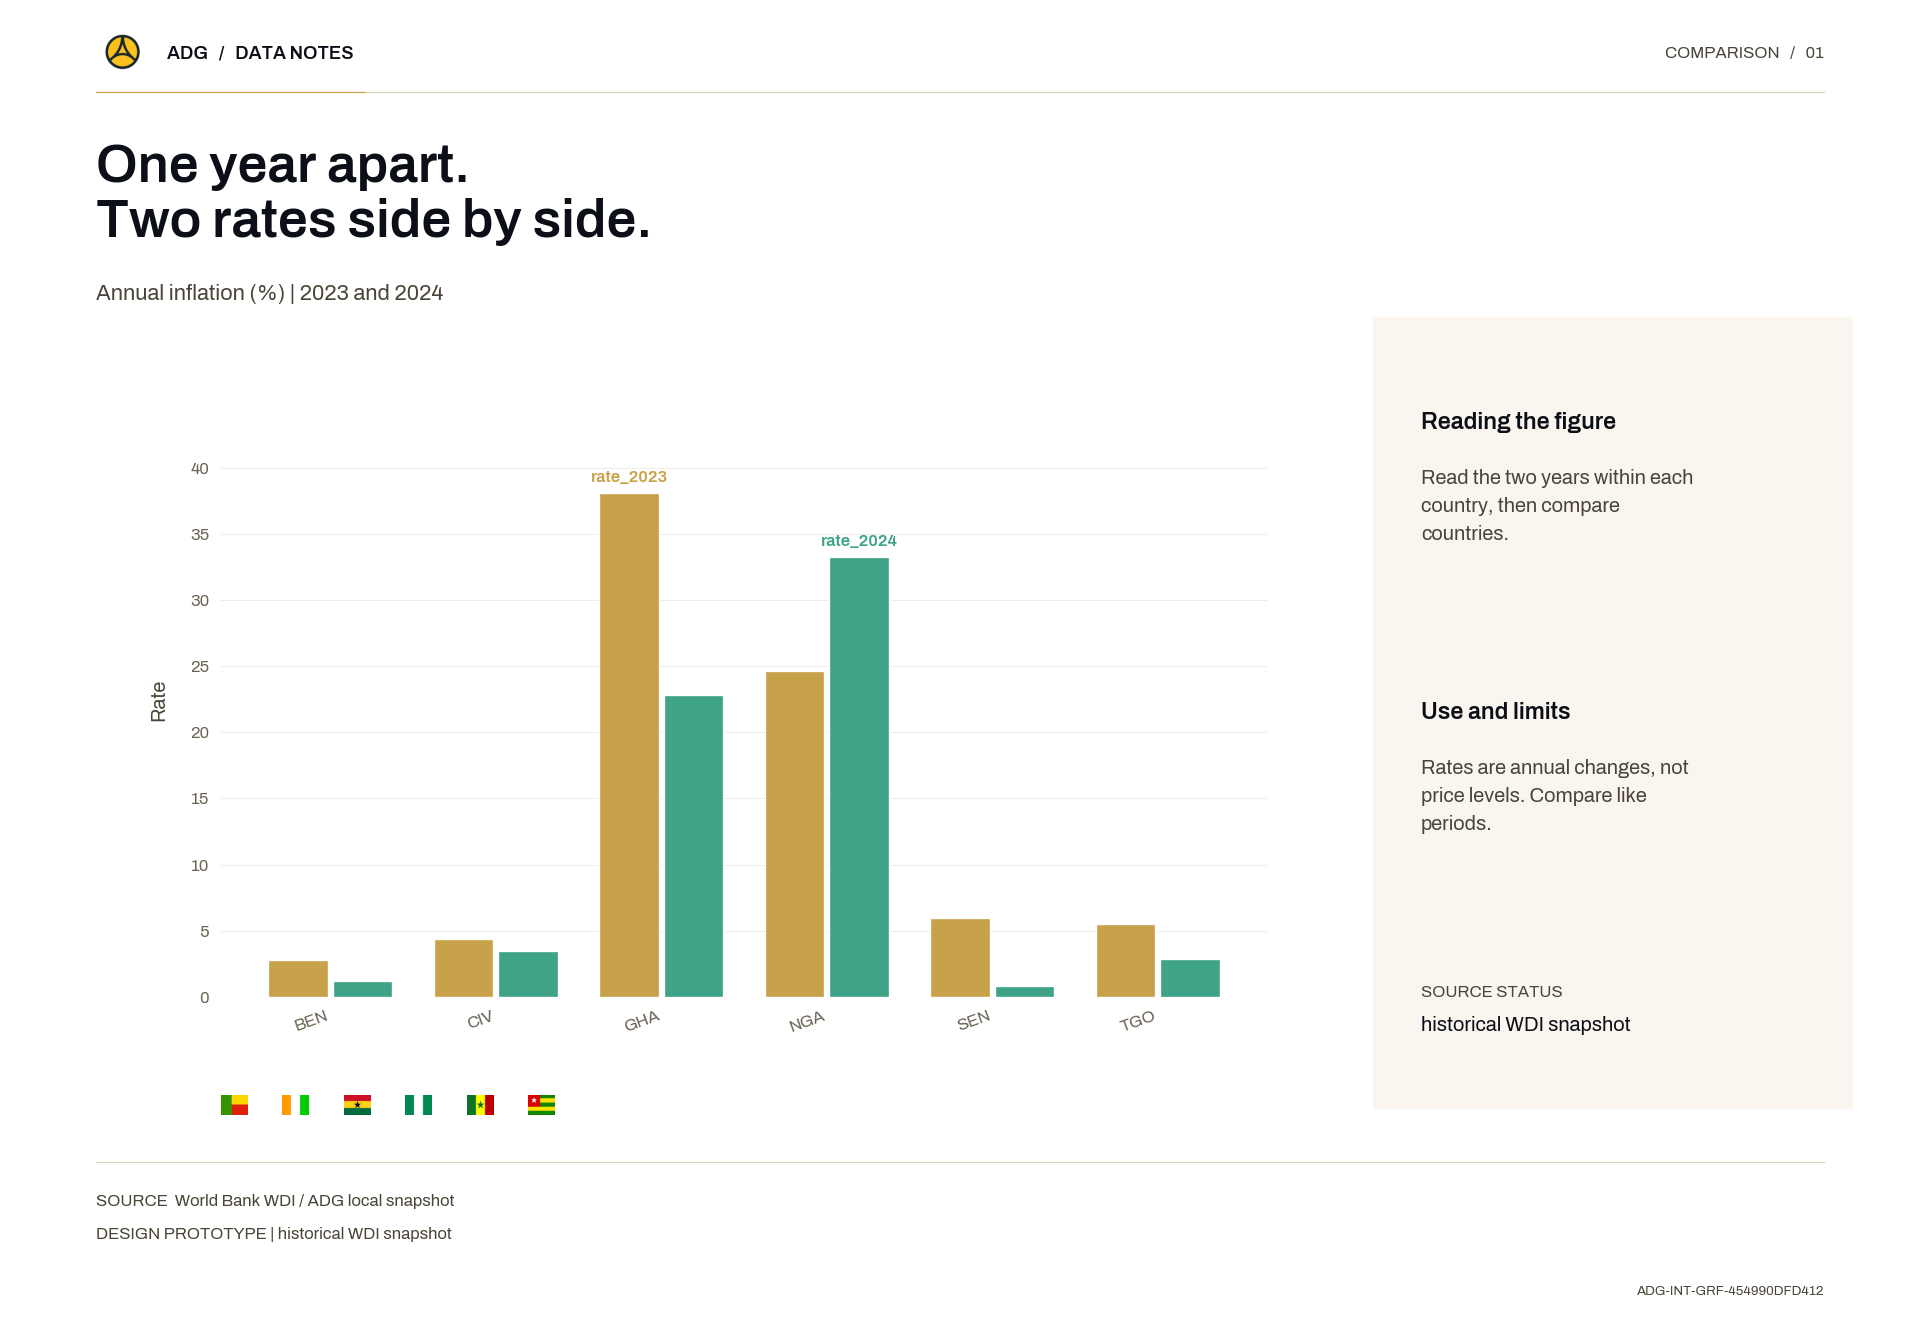
One year apart. Two rates side by side.
Maps Visualization

Un an d'écart. Deux taux côte à côte.

Read the two years within each country, then compare countries.Data source: World Bank WDI / ADG local snapshotMethod: Rates are annual changes, not price levels. Compare like periods.

Description
Lisez les deux années au sein de chaque pays, puis comparez les pays entre eux.

Read the two years within each country, then compare countries.

Data source: World Bank WDI / ADG local snapshot

Method: Rates are annual changes, not price levels. Compare like periods.

Publication Date
Visual Type
Thumbnail / Cover Image
One year apart. Two rates side by side.
Methodology
Rates are annual changes, not price levels. Compare like periods.
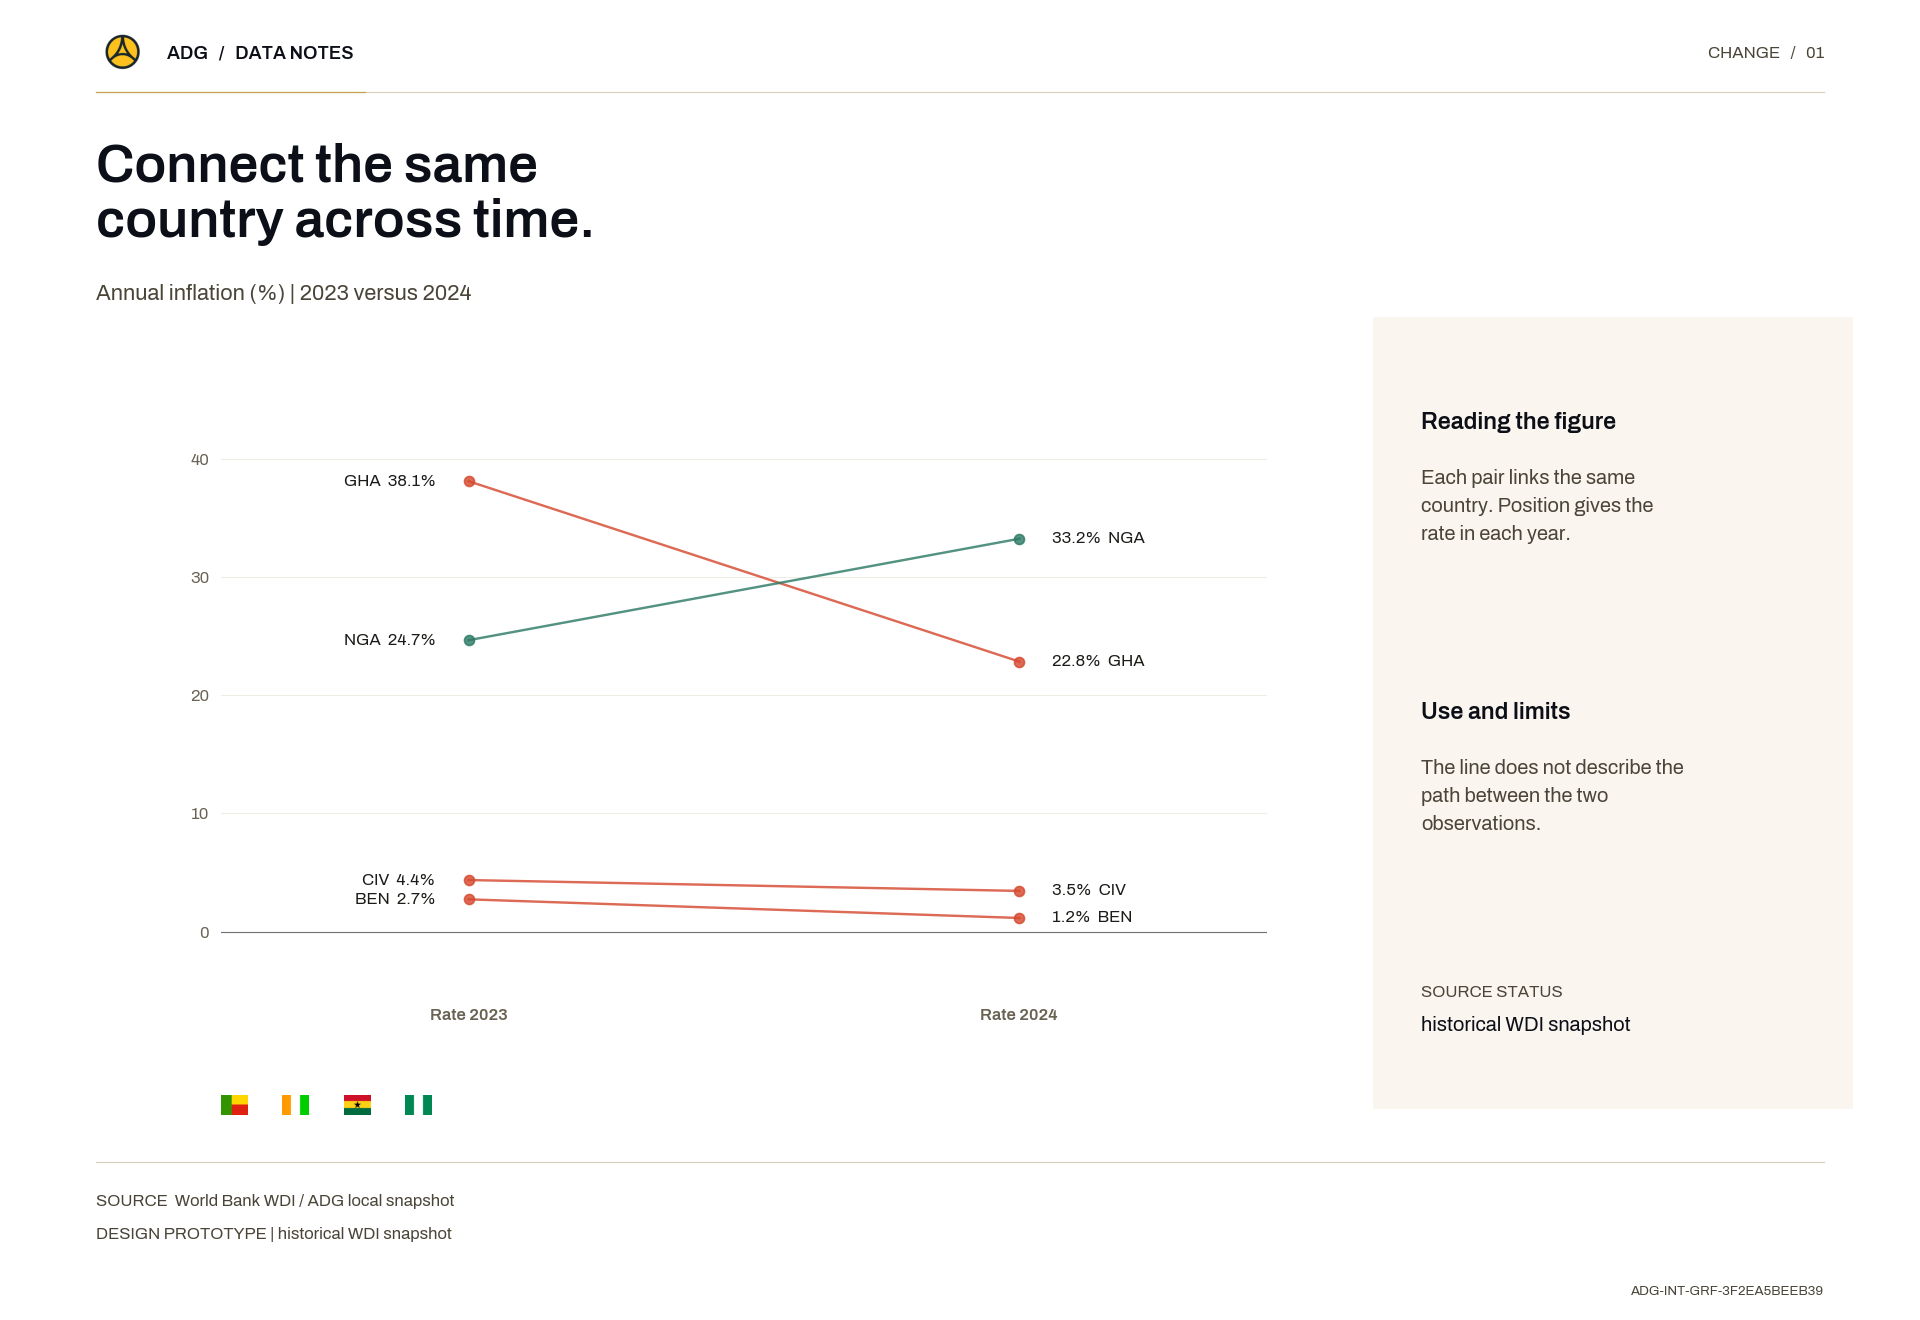
Connect the same country across time.
Maps Visualization

Relier un même pays d'une année à l'autre.

Each pair links the same country. Position gives the rate in each year.Data source: World Bank WDI / ADG local snapshotMethod: The line does not describe the path between the two observations.

Description
Chaque paire relie un même pays. La position donne le taux de chaque année.

Each pair links the same country. Position gives the rate in each year.

Data source: World Bank WDI / ADG local snapshot

Method: The line does not describe the path between the two observations.

Publication Date
Visual Type
Thumbnail / Cover Image
Connect the same country across time.
Methodology
The line does not describe the path between the two observations.
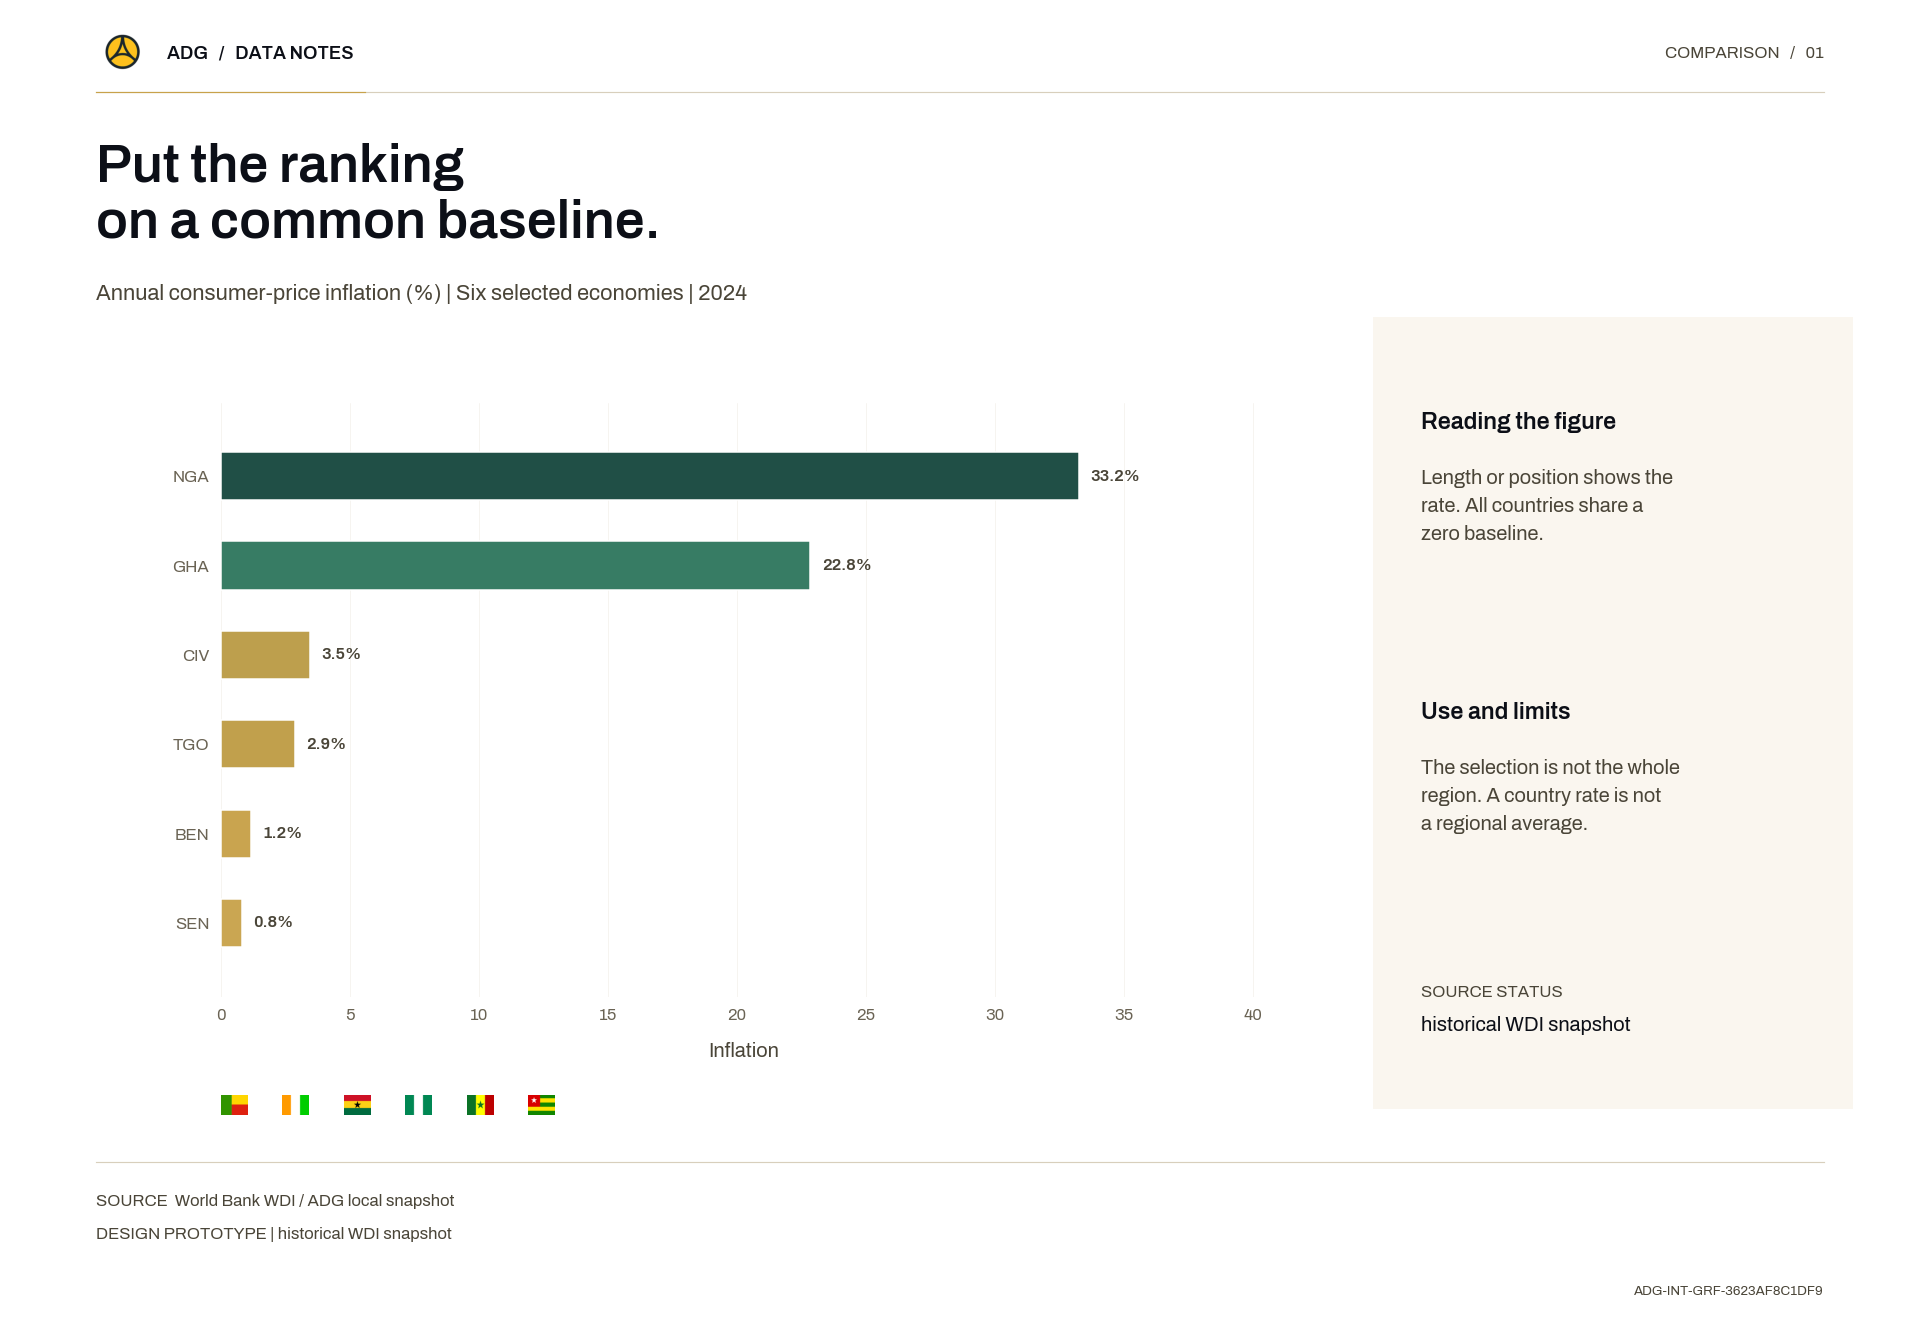
Put the ranking on a common baseline.
Maps Visualization

Ramener le classement à une base commune.

Length or position shows the rate. All countries share a zero baseline.Data source: World Bank WDI / ADG local snapshotMethod: The selection is not the whole region. A country rate is not a regional average.

Description
La longueur ou la position indique le taux. Tous les pays partagent une base zéro.

Length or position shows the rate. All countries share a zero baseline.

Data source: World Bank WDI / ADG local snapshot

Method: The selection is not the whole region. A country rate is not a regional average.

Publication Date
Visual Type
Thumbnail / Cover Image
Put the ranking on a common baseline.
Methodology
The selection is not the whole region. A country rate is not a regional average.

Aucun résultat trouvé

Essayez d'ajuster votre recherche ou vos filtres.