Editorial content. This page contains the full editorial reading. Social media cards are separate promotional assets, shown in their own section.
Read the edition
Series ·
Publication day ·
Credits and sourcesHighest inflation in the region
The development: Highest inflation in the region: Nigeria 23.0% (2025).
What the evidence says: One figure, one country, one year. Source: World Bank WDI.
Question to watch: Which of these gaps matters most for your country?
GDP growth 2025
The development: GDP growth 2025: where does your country sit?
What the evidence says: Five classed ranges, with the number of countries in each. Lowest Nigeria 4.0% · highest Benin 8.1%.
Question to watch: Which of these gaps matters most for your country?
Inflation 2025
The development: Inflation 2025: where does your country sit?
What the evidence says: Five classed ranges, with the number of countries in each. Lowest Niger -4.5% · highest Nigeria 23.0%.
Question to watch: Which of these gaps matters most for your country?
Unemployment 2025
The development: Unemployment 2025: where does your country sit?
What the evidence says: Five classed ranges, with the number of countries in each. Lowest Niger 0.4% · highest Cabo Verde 11.9%.
Question to watch: Which of these gaps matters most for your country?
GDP per person: ten years of change
The development: 2015–2025: annual regional mean.
What the evidence says: Annual unweighted national mean · constant 2015 US$ · 16 countries. The country count in each year is recorded in the edition data.
Real GDP growth: ten years of change
The development: 2015–2025: annual regional mean.
What the evidence says: Annual unweighted national mean · annual % · 16 countries. The country count in each year is recorded in the edition data.
Unemployment: ten years of change
The development: 2015–2025: annual regional mean.
What the evidence says: Annual unweighted national mean · % of labour force · 16 countries. The country count in each year is recorded in the edition data.
Consumer price inflation: ten years of change
The development: 2015–2025: annual regional mean.
What the evidence says: Annual unweighted national mean · annual % · 16 countries. The country count in each year is recorded in the edition data.
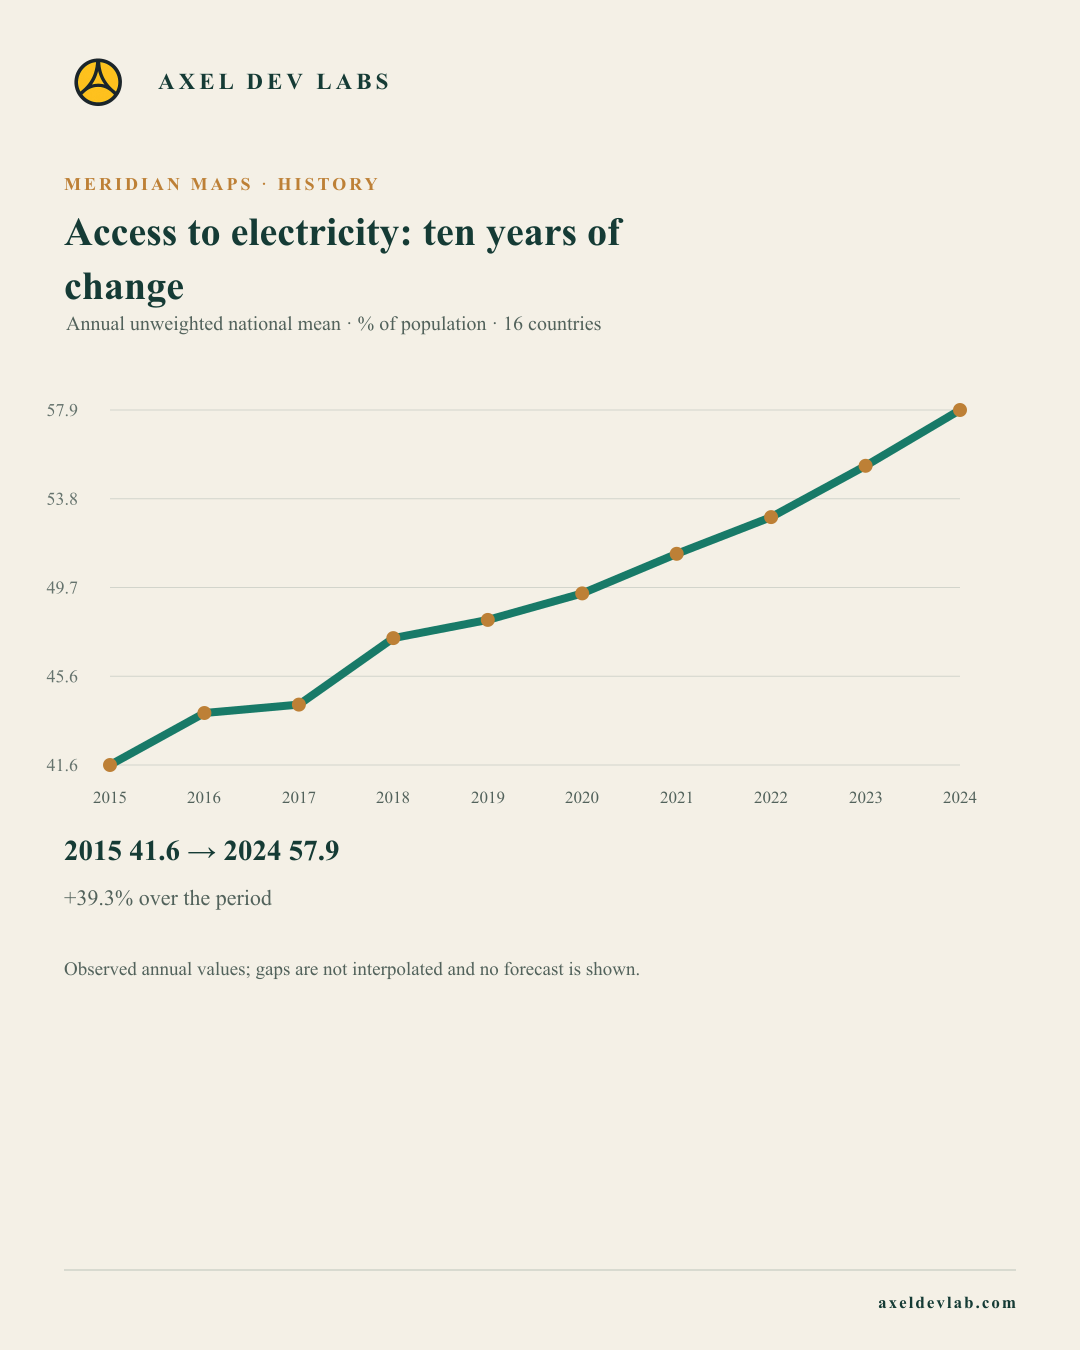
Access to electricity: ten years of change
The development: 2015–2024: annual regional mean.
What the evidence says: Annual unweighted national mean · % of population · 16 countries. The country count in each year is recorded in the edition data.
Social media cards · separate promotional assets
Each link opens a social-ready card image, its platform caption and permanent post URL. These assets do not replace the editorial content above.