Adg Production Batch
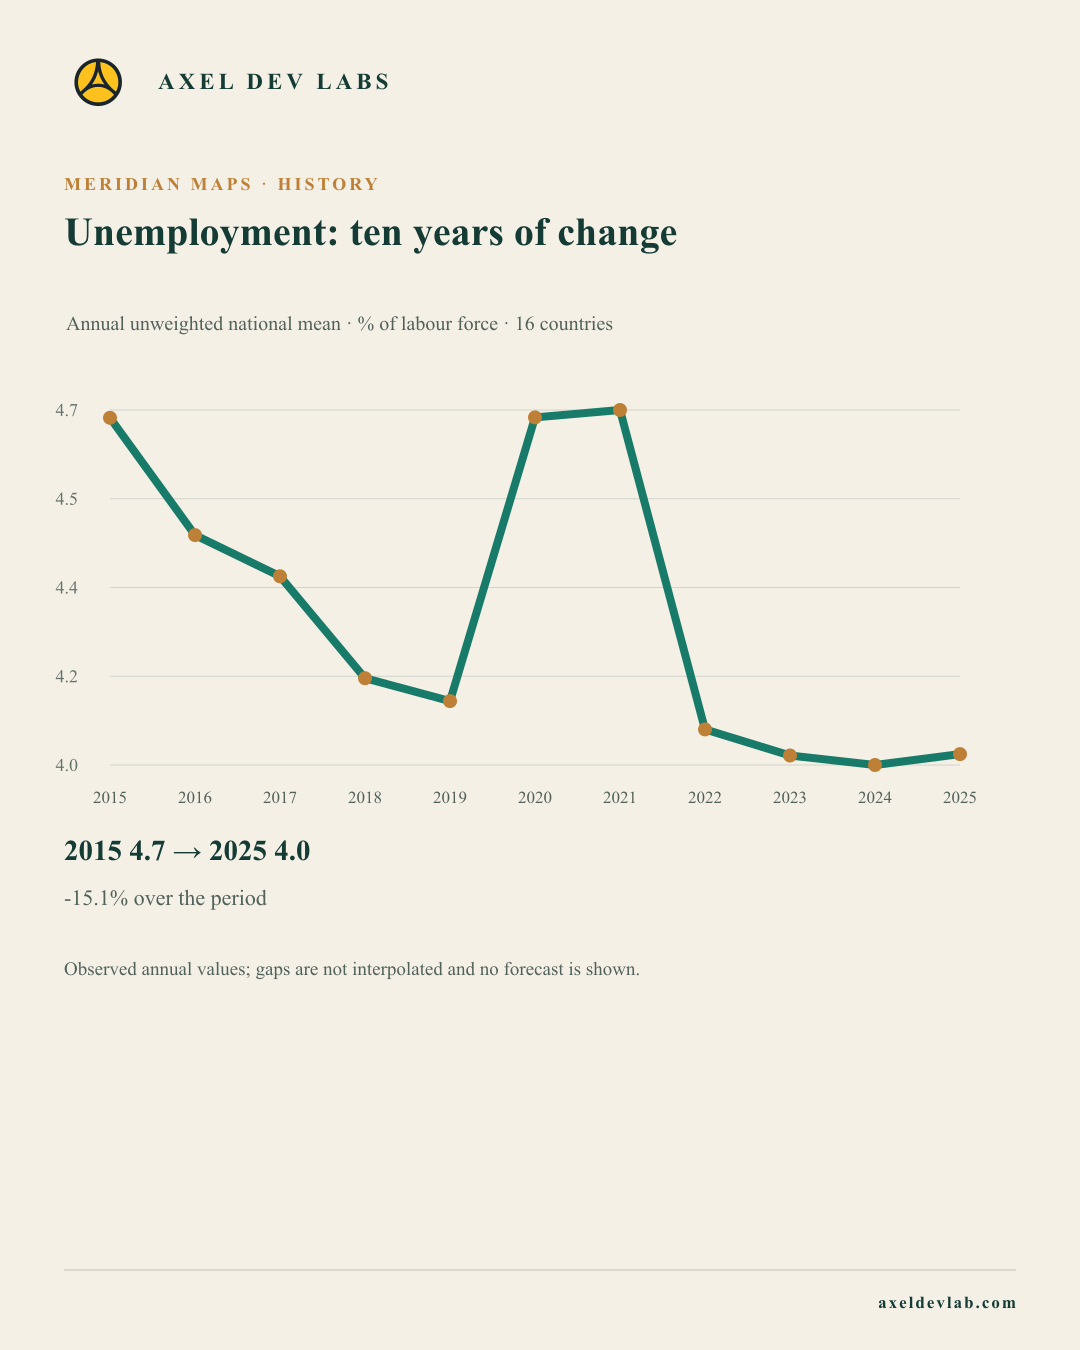
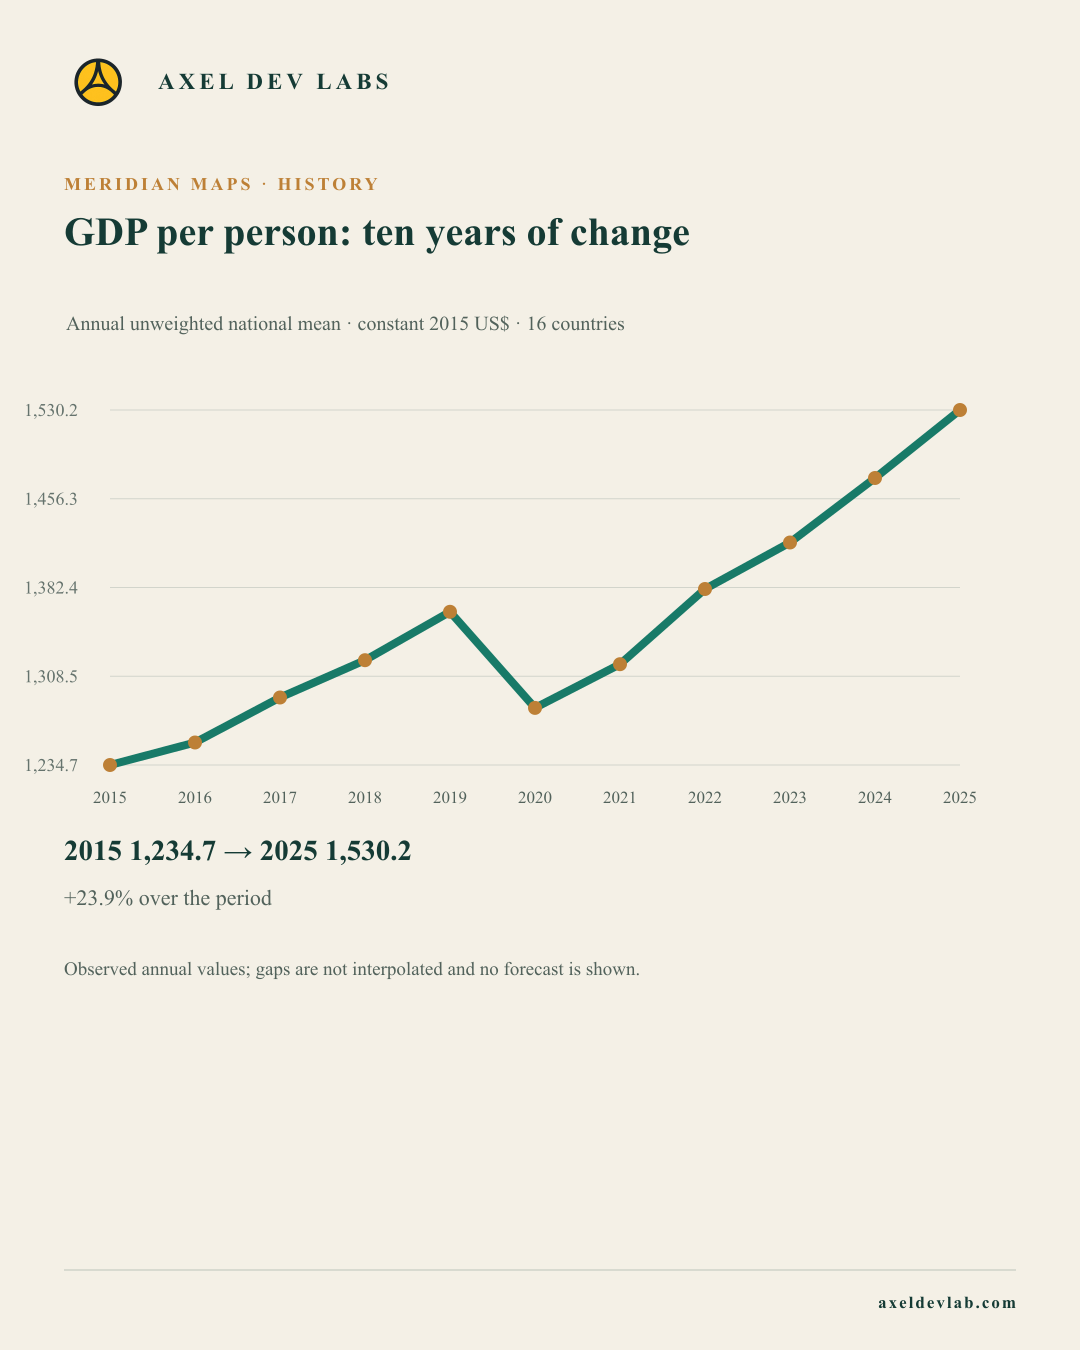
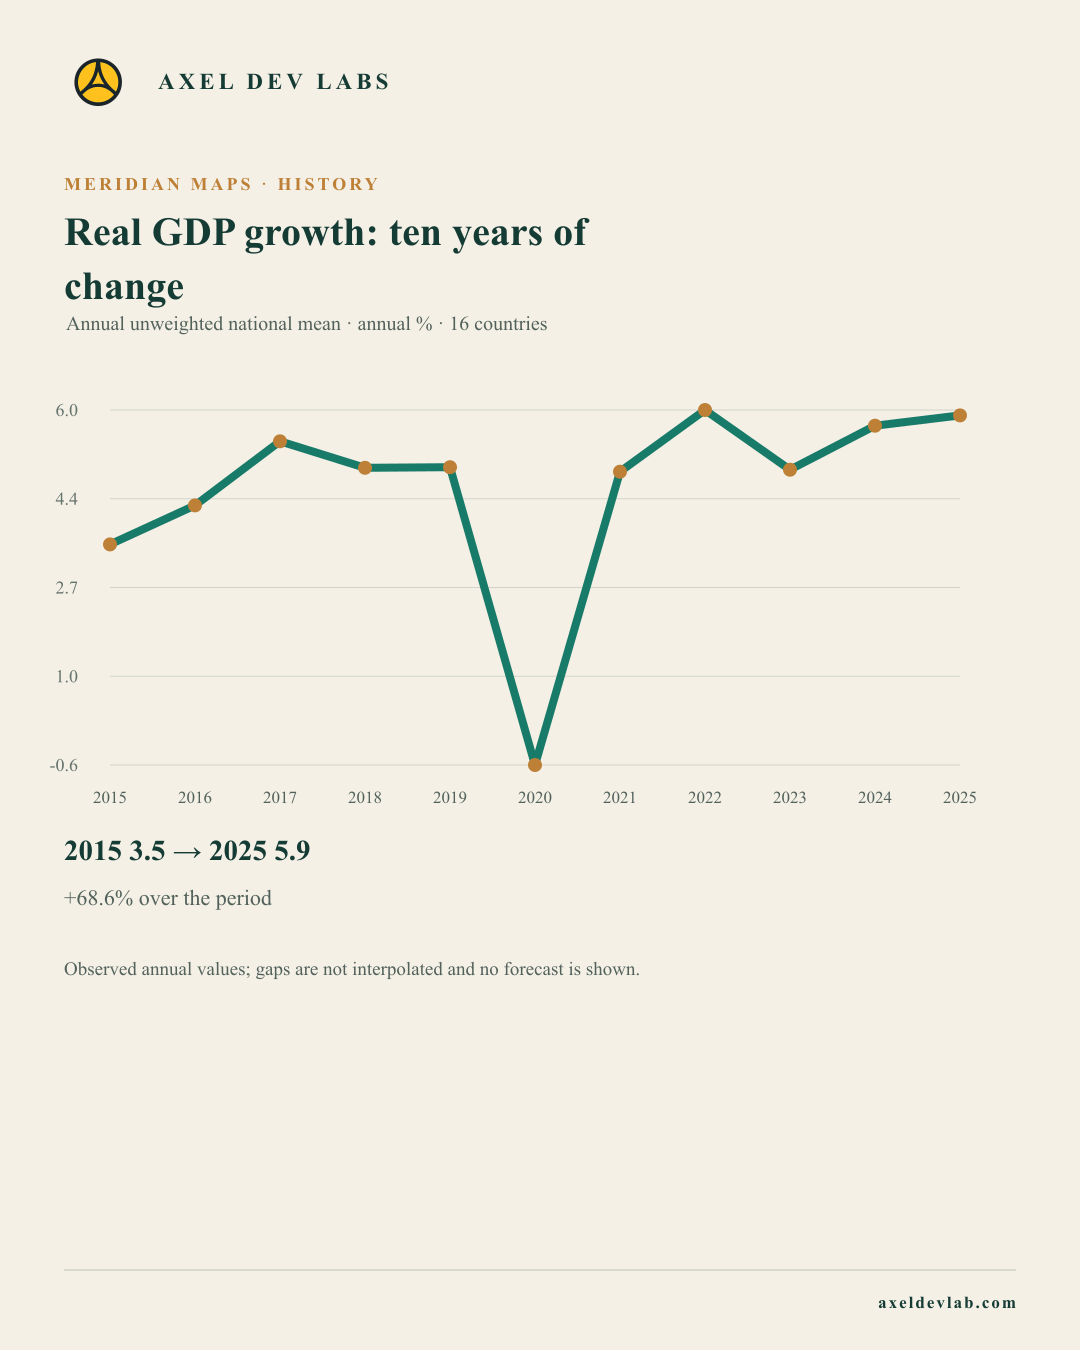
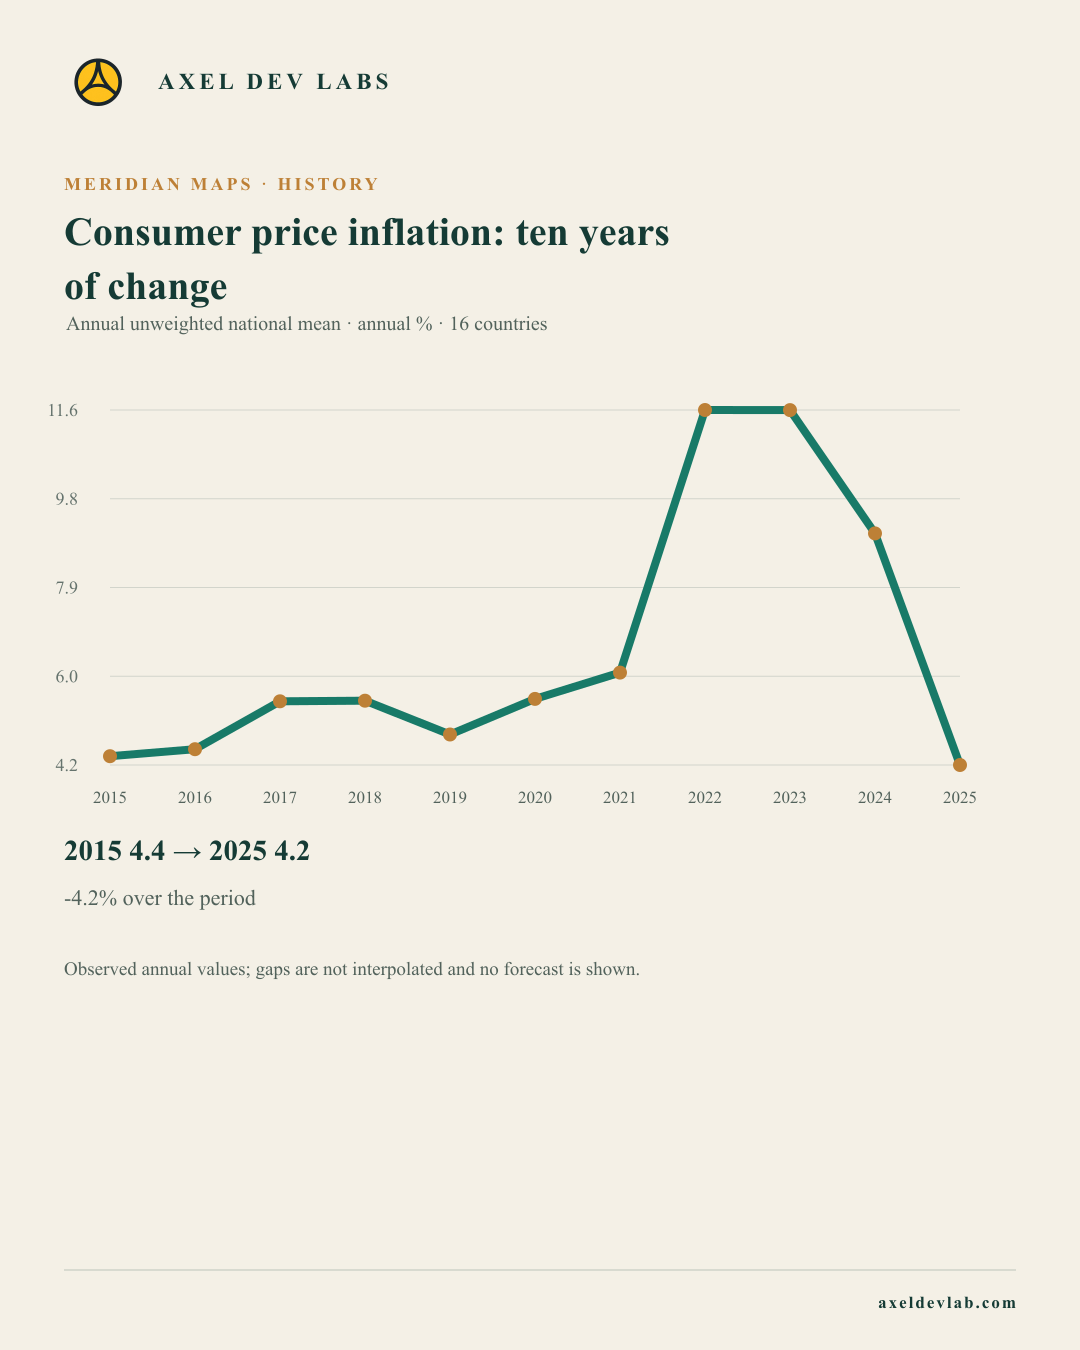
Five ten-year evolution charts for GDP per person, real GDP growth, unemployment, consumer-price inflation and electricity access, with supporting maps, evidence and a separate credits page. Each chart preserves its source, coverage and limitations.
Oct 16, 2026 1 min read
2026-10-15
- Read the edition pages
- Publication day
- Meridian Maps · Ten-year regional trends · Highest inflation in the region
- Access to electricity: ten years of change
- Consumer price inflation: ten years of change
- Real GDP growth: ten years of change
- GDP per person: ten years of change
- Unemployment: ten years of change
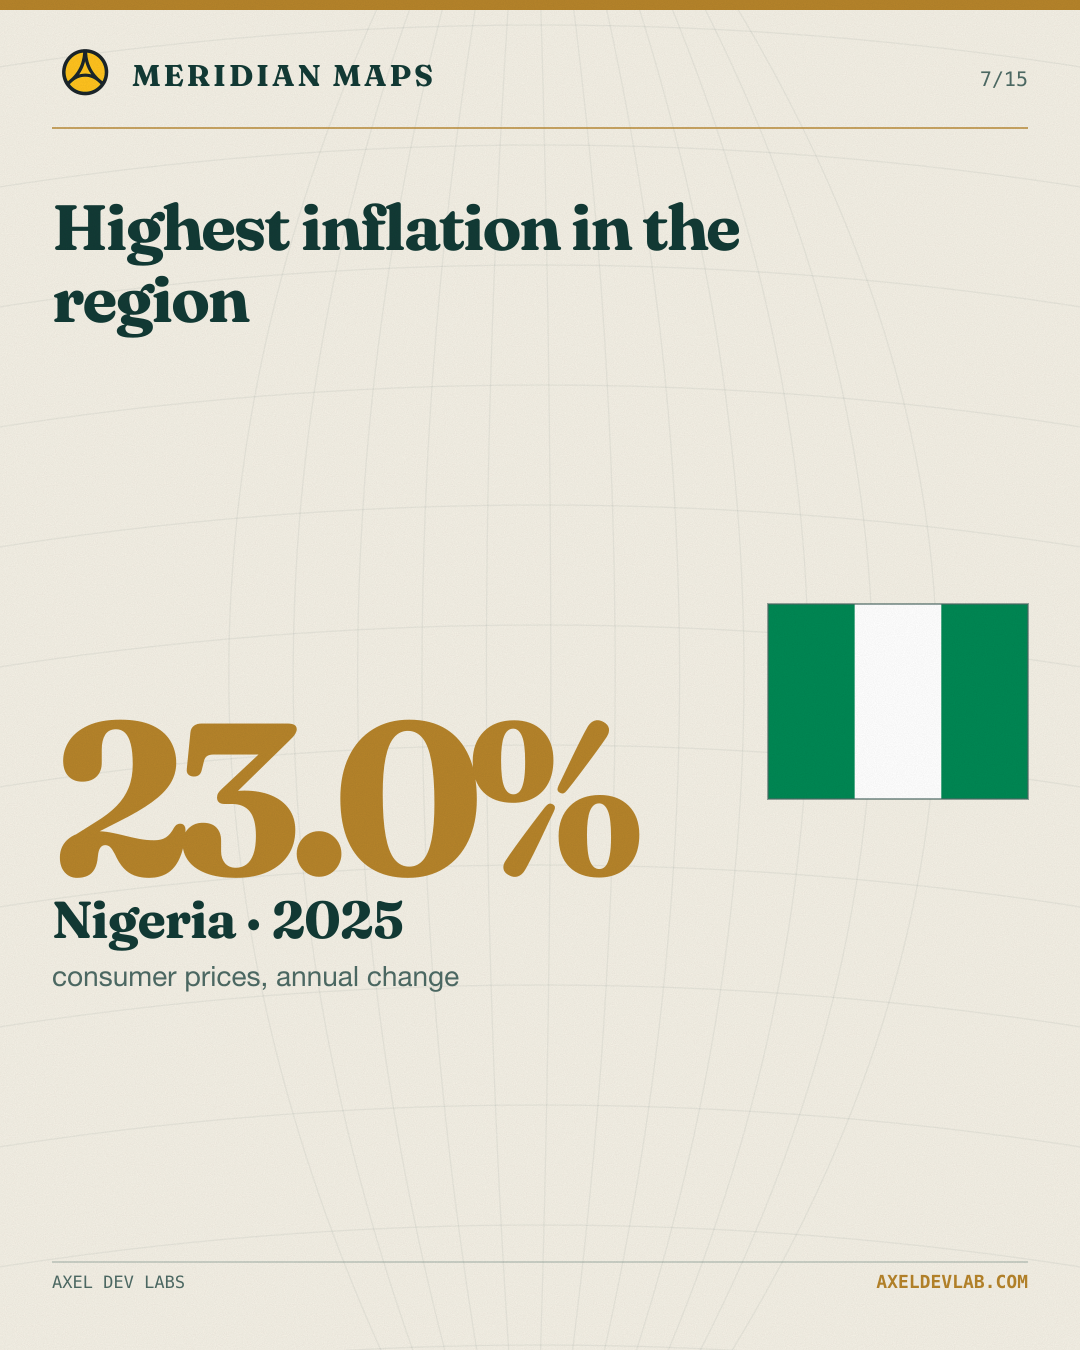
- Highest inflation in the region
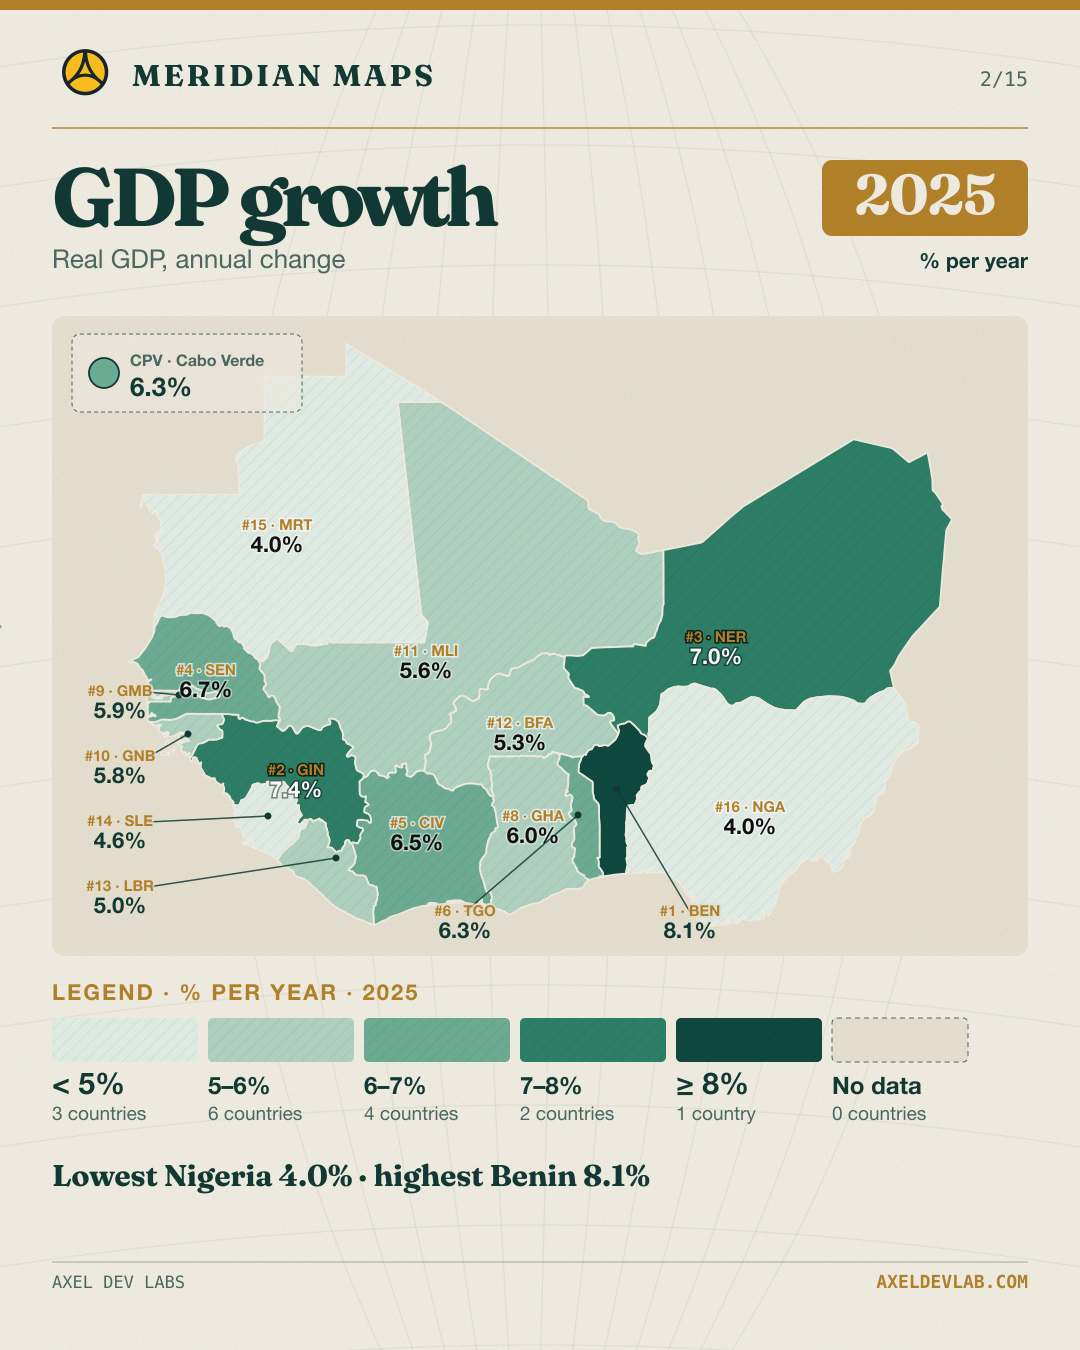
- GDP growth 2025
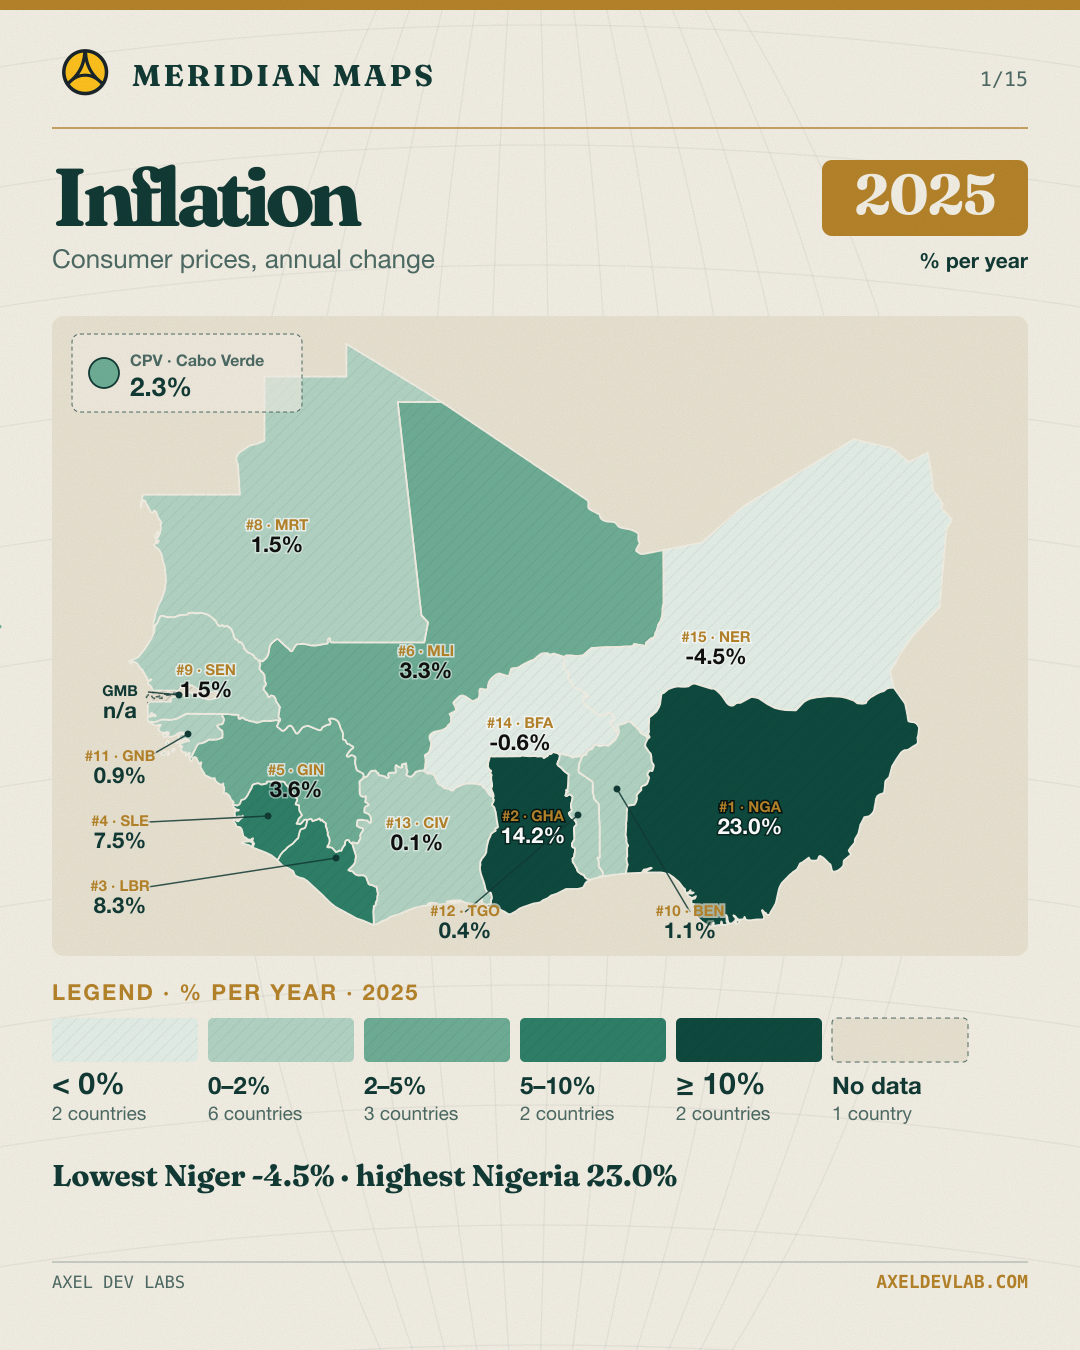
- Inflation 2025
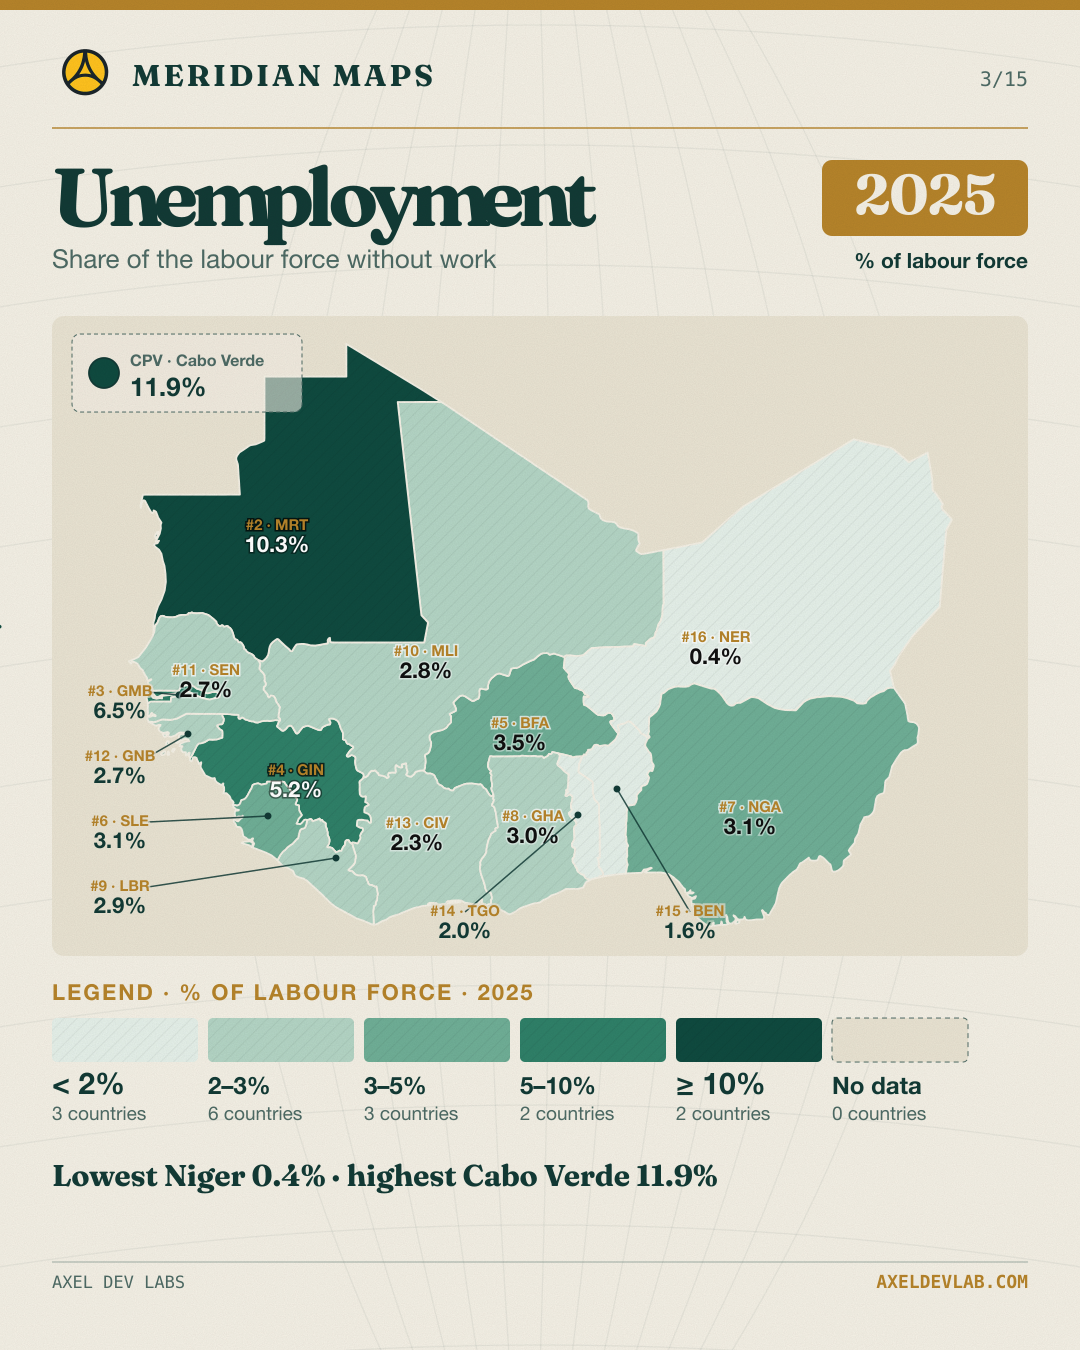
- Unemployment 2025
- Credits, sources and asset notes
ADG production taxonomy