Editorial content. This page contains the full editorial reading. Social media cards are separate promotional assets, shown in their own section.
Read the edition
Series ·
Publication day ·
Credits and sourcesConsumer price inflation · 2025
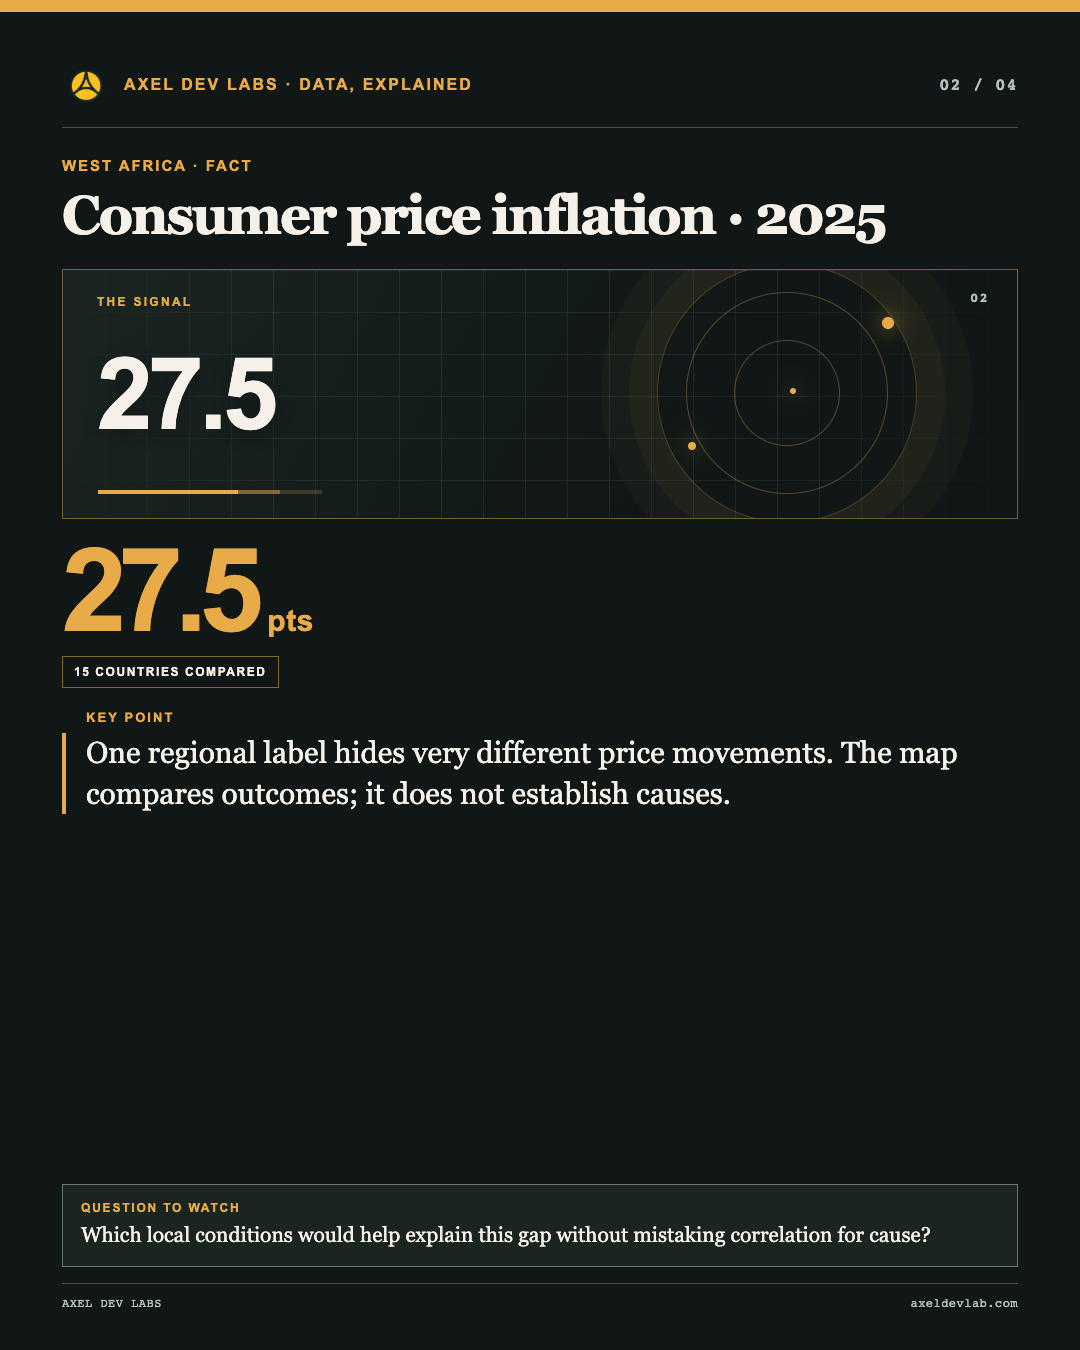
The development: A 27.5-point span separates the highest and lowest values in this 15-country comparison.
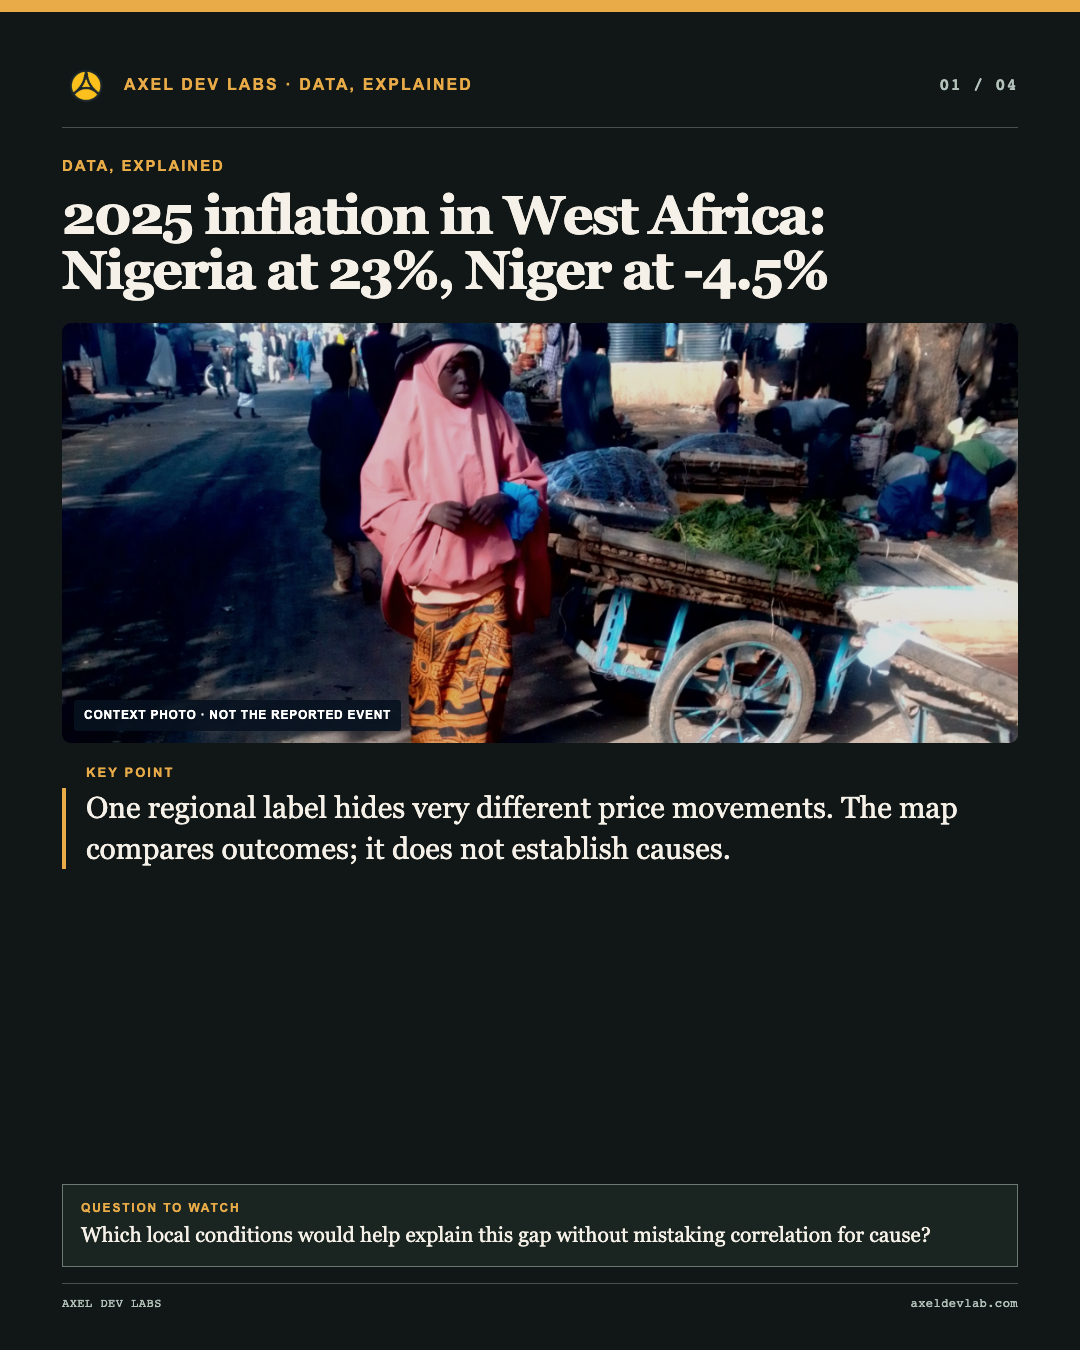
What the evidence says: One regional label hides very different price movements. The map compares outcomes; it does not establish causes.
Question to watch: Which local conditions would help explain this gap without mistaking correlation for cause?
Why it matters
The development: One regional label hides very different price movements. The map compares outcomes; it does not establish causes.
What the evidence says: One regional label hides very different price movements. The map compares outcomes; it does not establish causes.
Question to watch: Which local conditions would help explain this gap without mistaking correlation for cause?
Which local conditions would help explain this gap without mistaking correlation for cause?
The development: A 27.5-point span separates the highest and lowest values in this 15-country comparison.
What the evidence says: One regional label hides very different price movements. The map compares outcomes; it does not establish causes.
Question to watch: Which local conditions would help explain this gap without mistaking correlation for cause?
Social media cards · separate promotional assets
Each link opens a social-ready card image, its platform caption and permanent post URL. These assets do not replace the editorial content above.