Adg Social Post
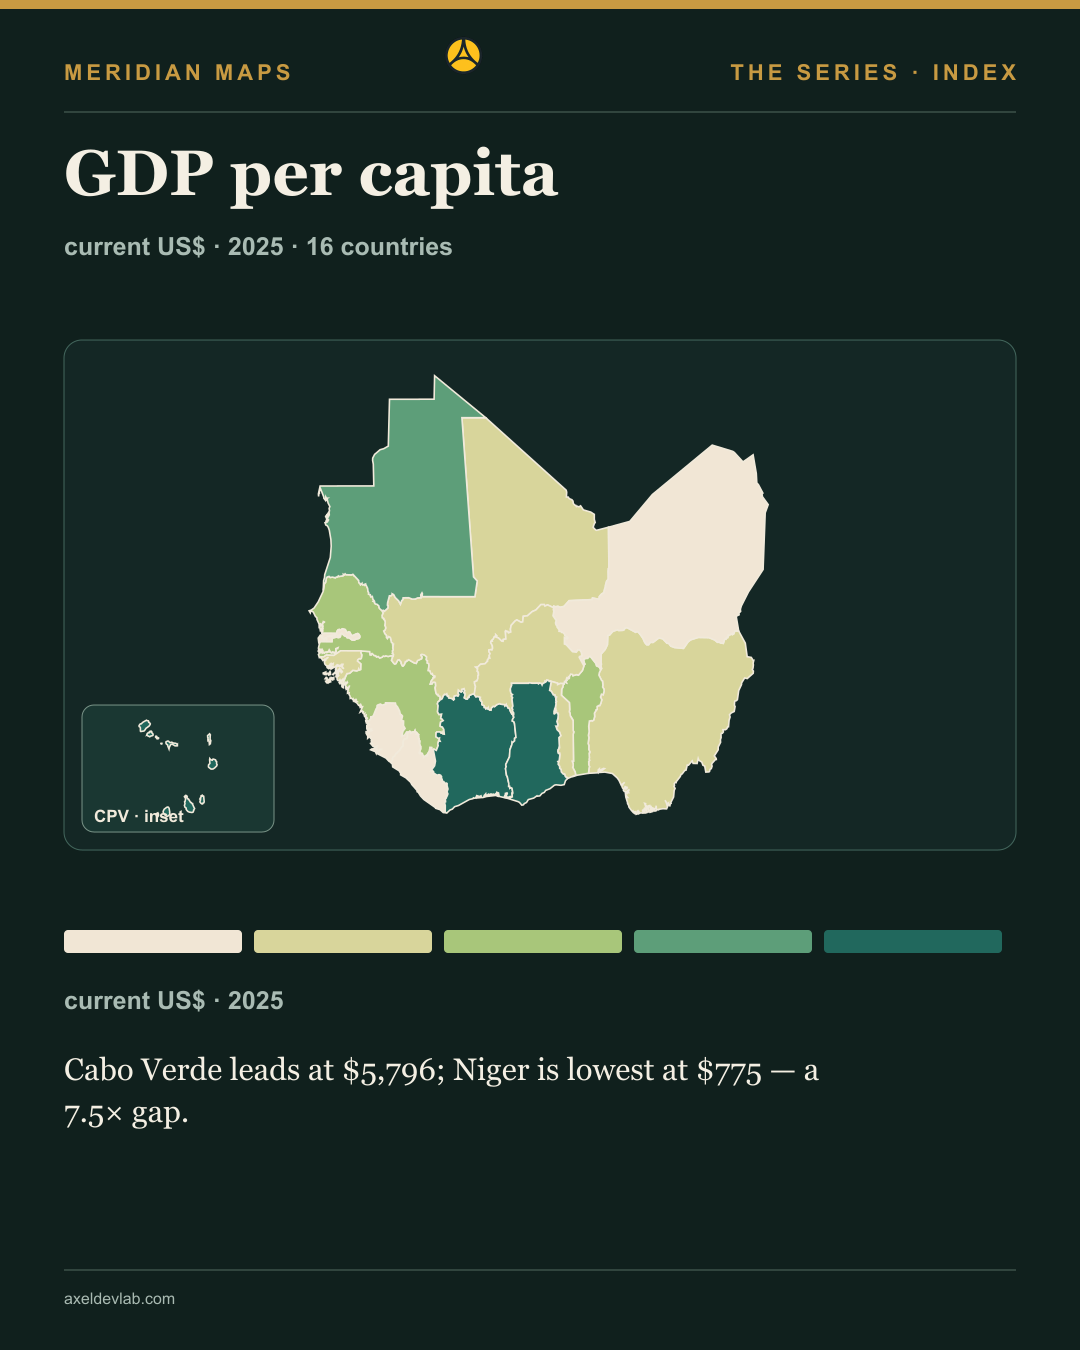
Reading the GDP per capita map

Social media card · promotional asset

This image and caption are short-form social distribution assets. They are separate from the full editorial content and do not replace it.

Reading the GDP per capita map

A national average cannot show income distribution within a country.

Values are current US dollars per person for 2025. Fixed class edges support comparison across years; they do not measure household income or purchasing power.

Which country would you examine first?

Follow Axel Dev Lab, like and share this map. Subscribe for the next maps.
More information and data

Read the complete edition

Adg Social Post
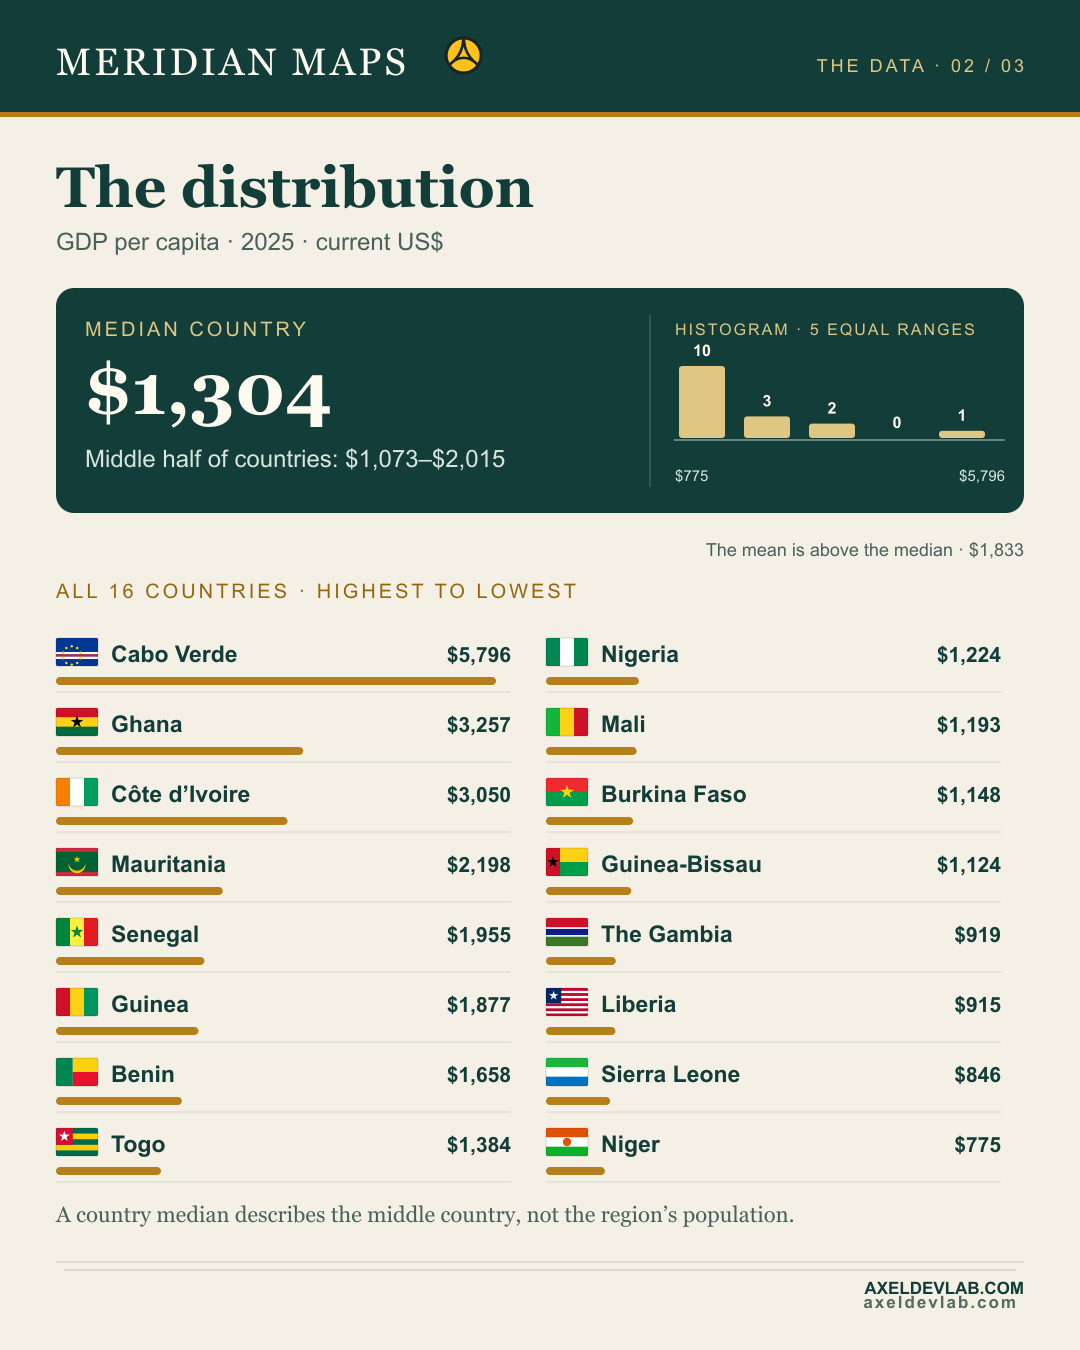
How countries compare with the regional mean

Social media card · promotional asset

This image and caption are short-form social distribution assets. They are separate from the full editorial content and do not replace it.

How countries compare with the regional mean

current US$ · 2025 · Fixed class edges, so years can be compared directly.

The median and mean answer different questions.

Why do the mean and median differ here?

Follow Axel Dev Lab, like and share this map. Subscribe for the next maps.

More information and data

Read the complete edition

Adg Publication Day
Adg Publication Day
Adg Publication Day
Adg Publication Day
Adg Production Series

2025 West Africa GDP per capita cover with full map and on-map rankings, regional-mean distribution with flags, and a dedicated credits page. Ten-year evolution charts are a separate series.

Current editions

No results found

Try adjusting your search or filters.