Four-card evidence narrative per indicator and language
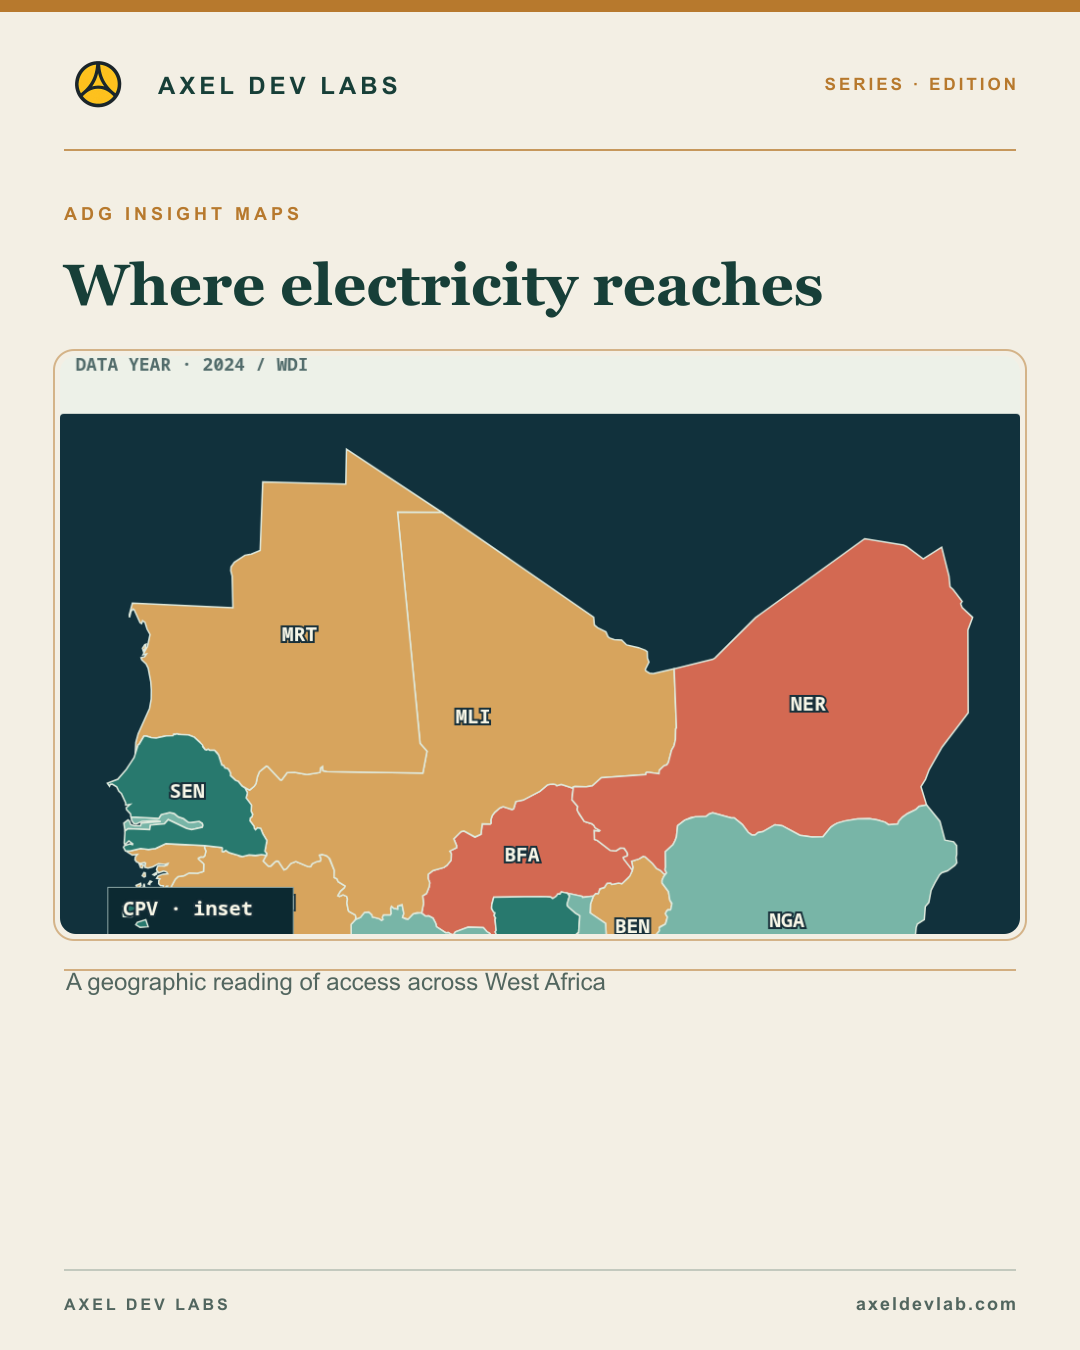
Editorial content. This page contains the full editorial reading. Social media cards are separate promotional assets, shown in their own section.
Read the edition
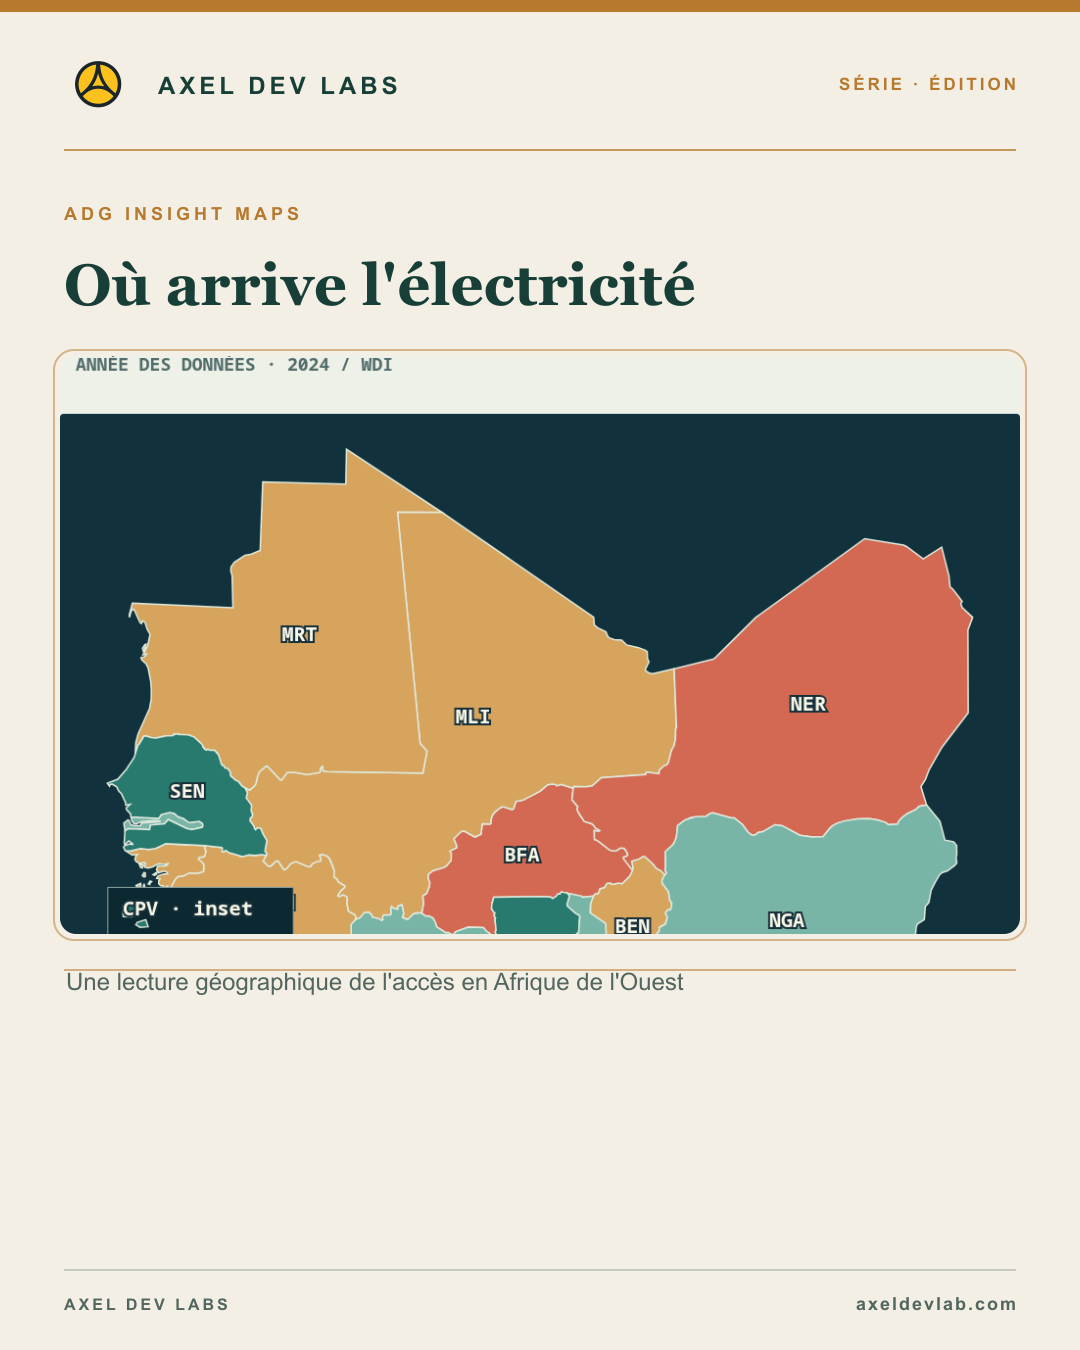
Series · Publication day · Credits and sourcesElectricity access varies.
The development: 16 / 16 countries · 2024
What the evidence says: Color encodes access rate, not policy success or cause.
Question to watch: Which countries share an access band?
Electricity access: two extremes.
The development: Niger 21.3% · Cabo Verde 98.4%
What the evidence says: 77.1 percentage-point range · 2024
Question to watch: What might explain the range without assuming a cause?
A national rate is not a local map.
The development: This figure describes the share of people with electricity access nationally. It cannot show which neighborhood or household is left out.
What the evidence says: Color encodes access rate, not policy success or cause.
Question to watch: What local evidence would test this national pattern?
Social media cards · separate promotional assets
Each link opens a social-ready card image, its platform caption and permanent post URL. These assets do not replace the editorial content above.