Adg Social Post
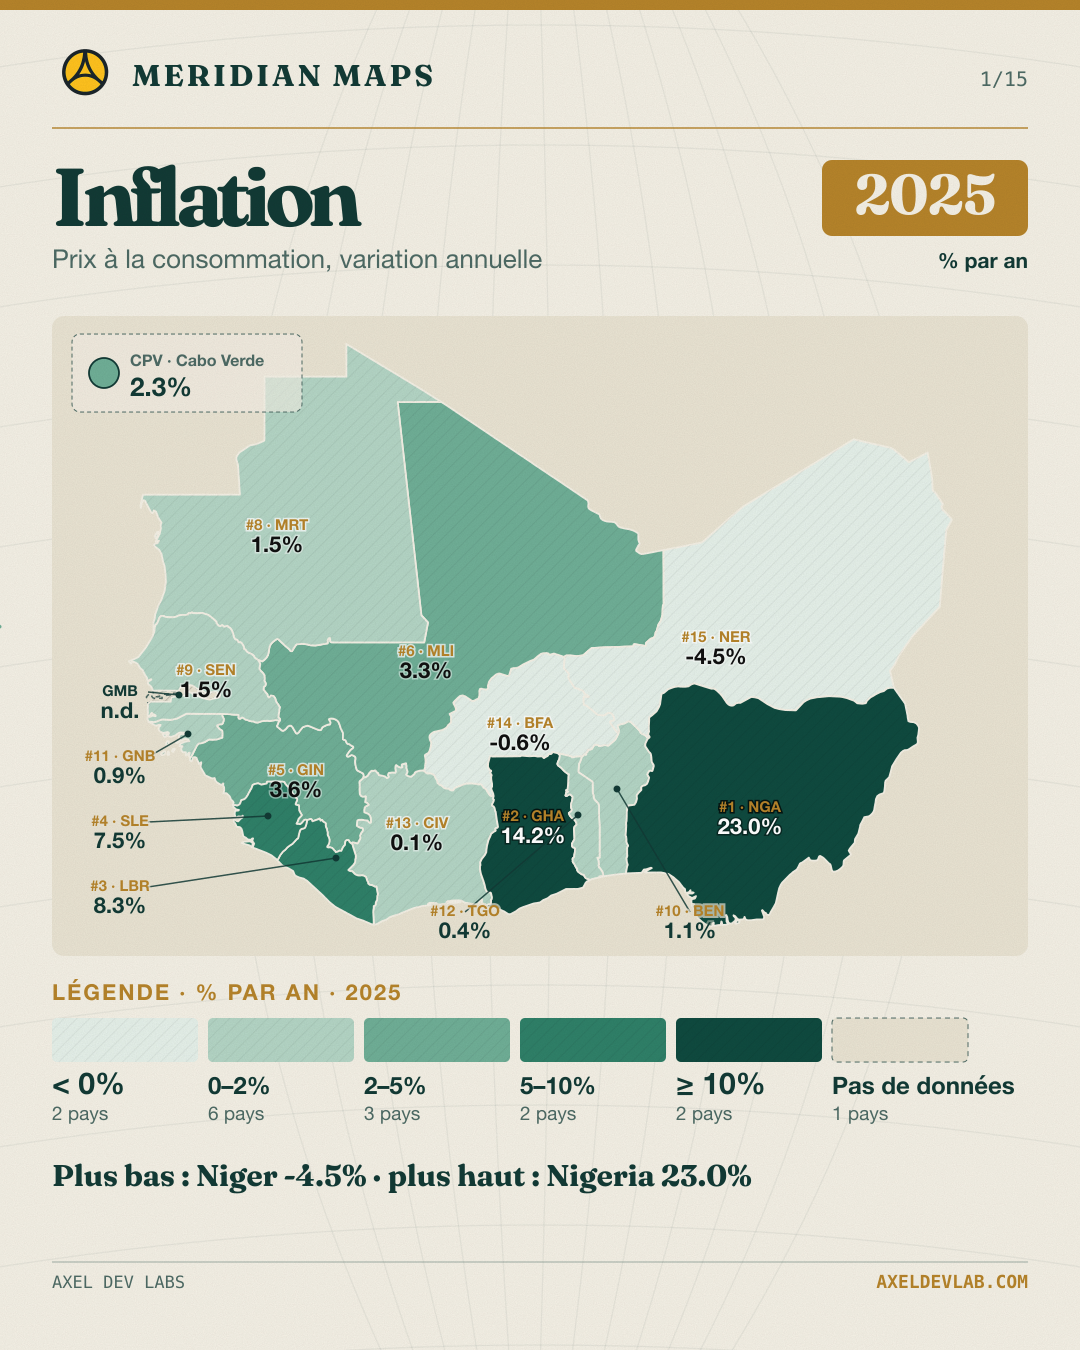
Consumer price inflation · regional finding

Social media card · promotional asset

This image and caption are short-form social distribution assets. They are separate from the full editorial content and do not replace it.

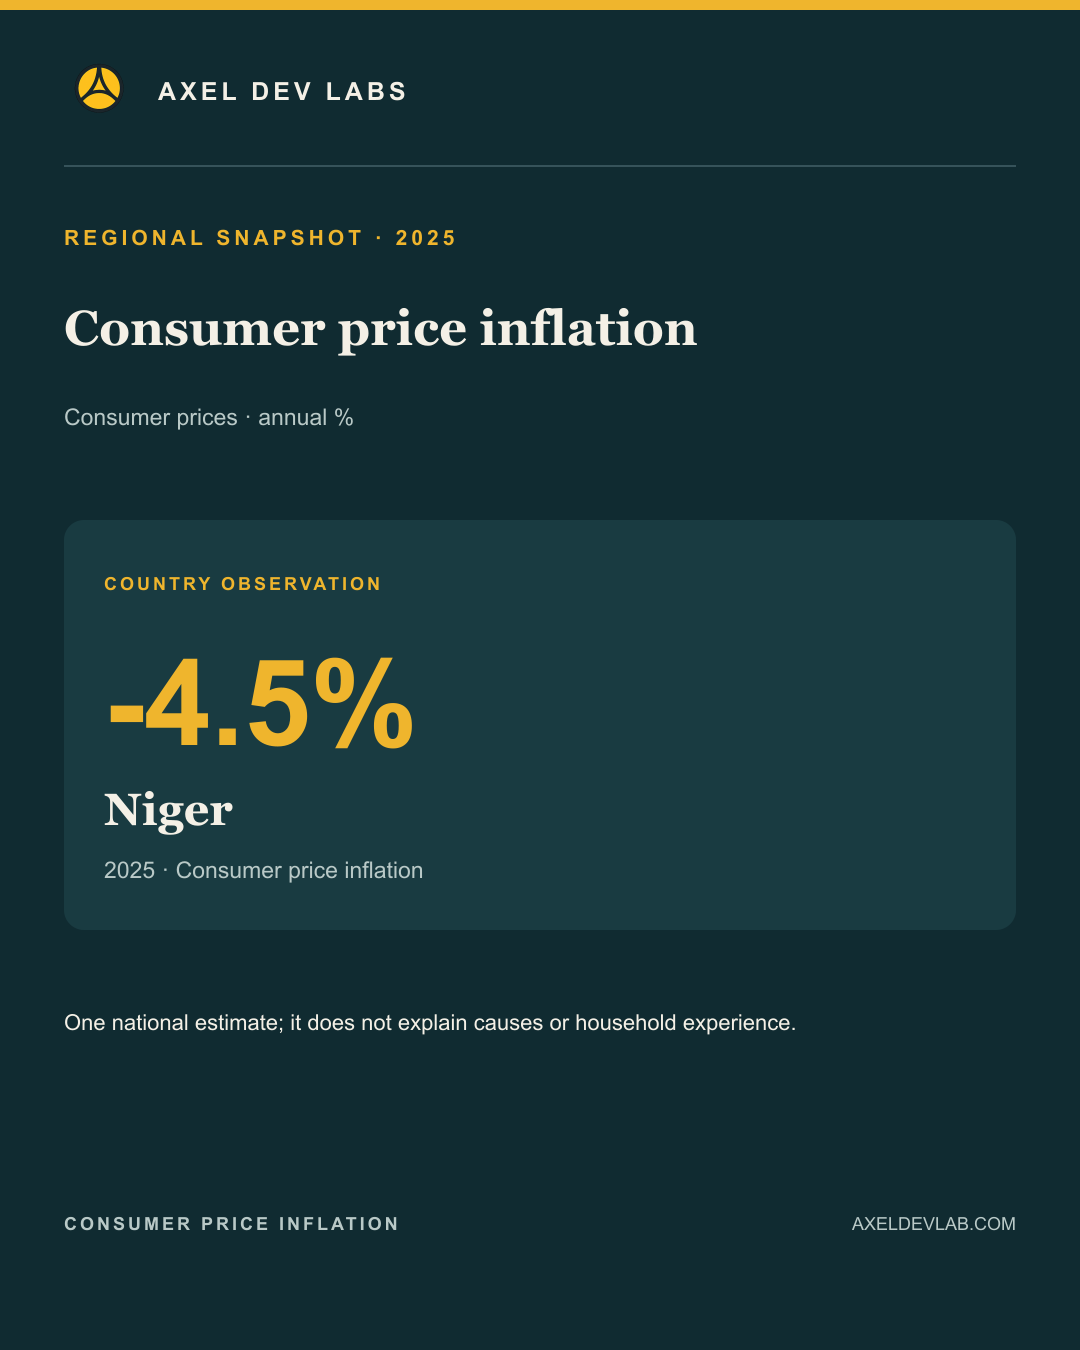
Consumer price inflation · regional finding

Lowest inflation (deflation): Niger -4.5% (2025).

A single national observation does not explain causes or household experience.

What local evidence would explain this national pattern?

Follow Axel Dev Lab for the next data card.

More information and data

Read the complete edition

Adg Social Post
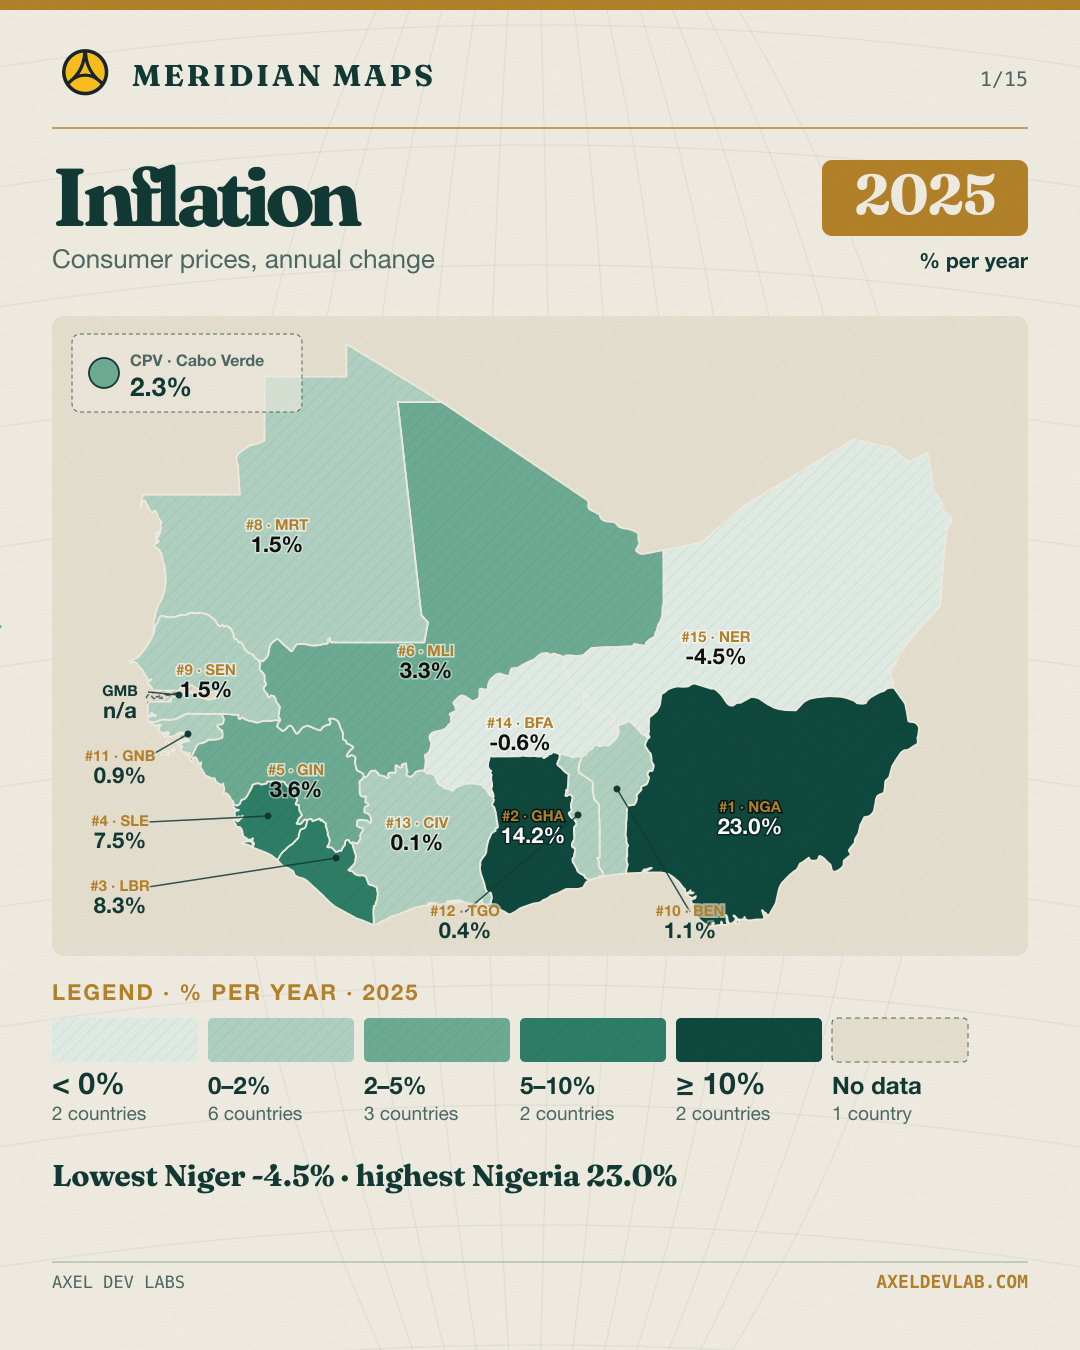
Consumer price inflation · 2025

Social media card · promotional asset

This image and caption are short-form social distribution assets. They are separate from the full editorial content and do not replace it.

Consumer price inflation · 2025

Compare available West African country observations.

National values do not show differences within countries.

Read this data brief: https://library.axeldevlab.com/node/289

More information and data

Read the complete edition

Adg Social Post
L’inflation en Afrique de l’Ouest

Carte pour les réseaux sociaux · support promotionnel

Cette image et sa légende sont des supports courts de diffusion sur les réseaux sociaux. Ils sont distincts du contenu éditorial complet et ne le remplacent pas.

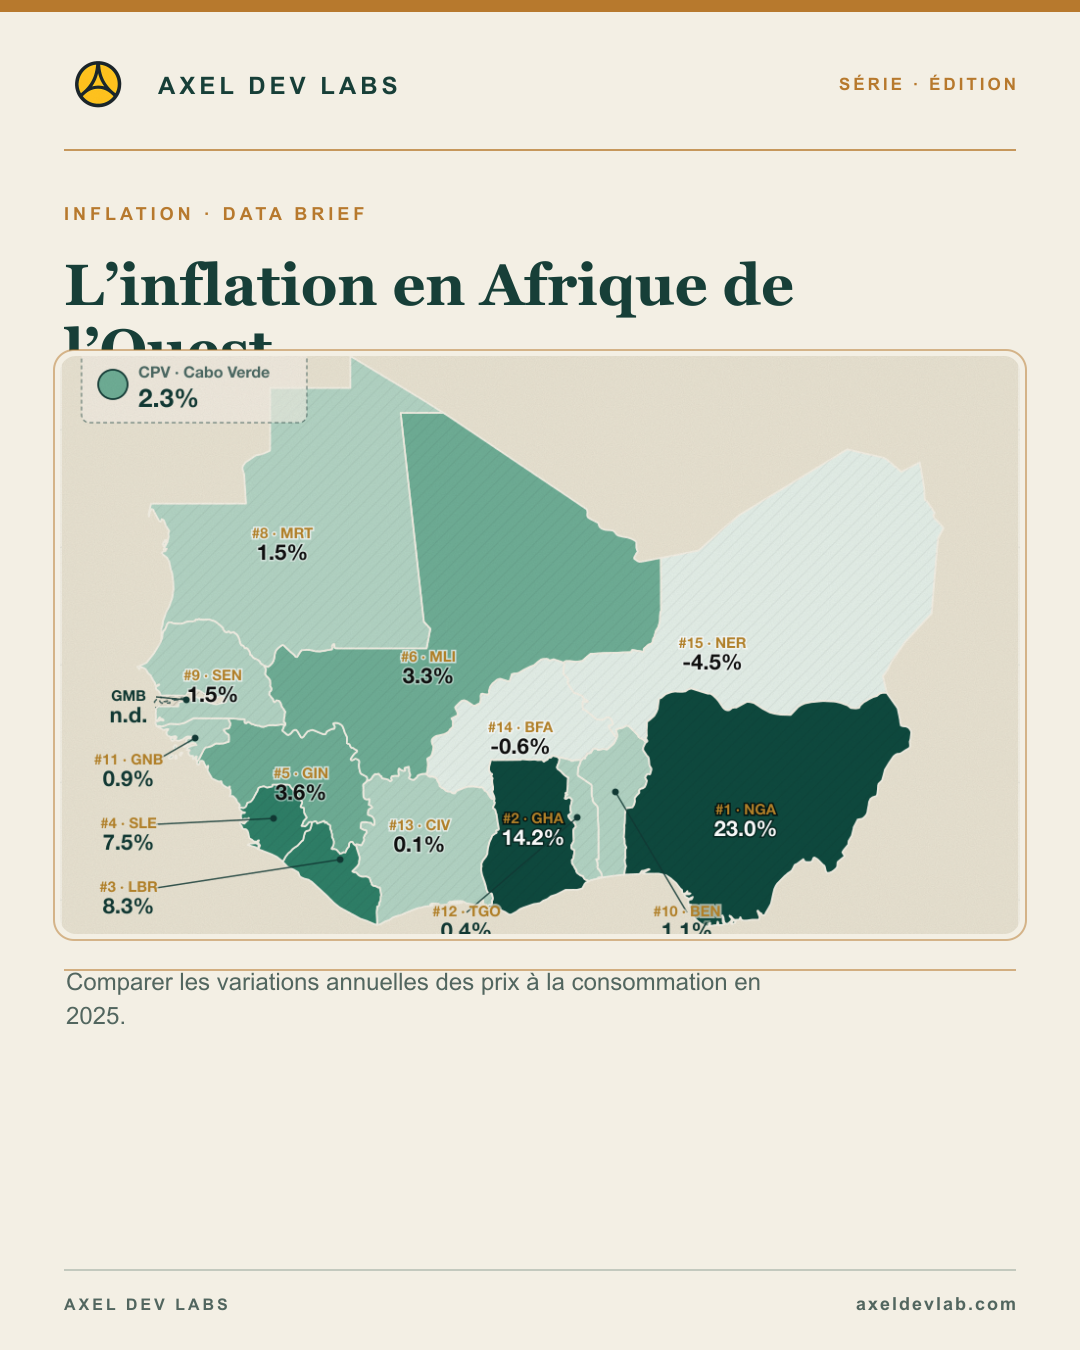
L’inflation en Afrique de l’Ouest

Comparer les variations annuelles des prix à la consommation en 2025.

2 sourced cards in this batch.

Read this edition: https://library.axeldevlab.com/node/290

More information and data

Read the complete edition

Adg Social Post
Inflation des prix à la consommation · résultat régional

Carte pour les réseaux sociaux · support promotionnel

Cette image et sa légende sont des supports courts de diffusion sur les réseaux sociaux. Ils sont distincts du contenu éditorial complet et ne le remplacent pas.

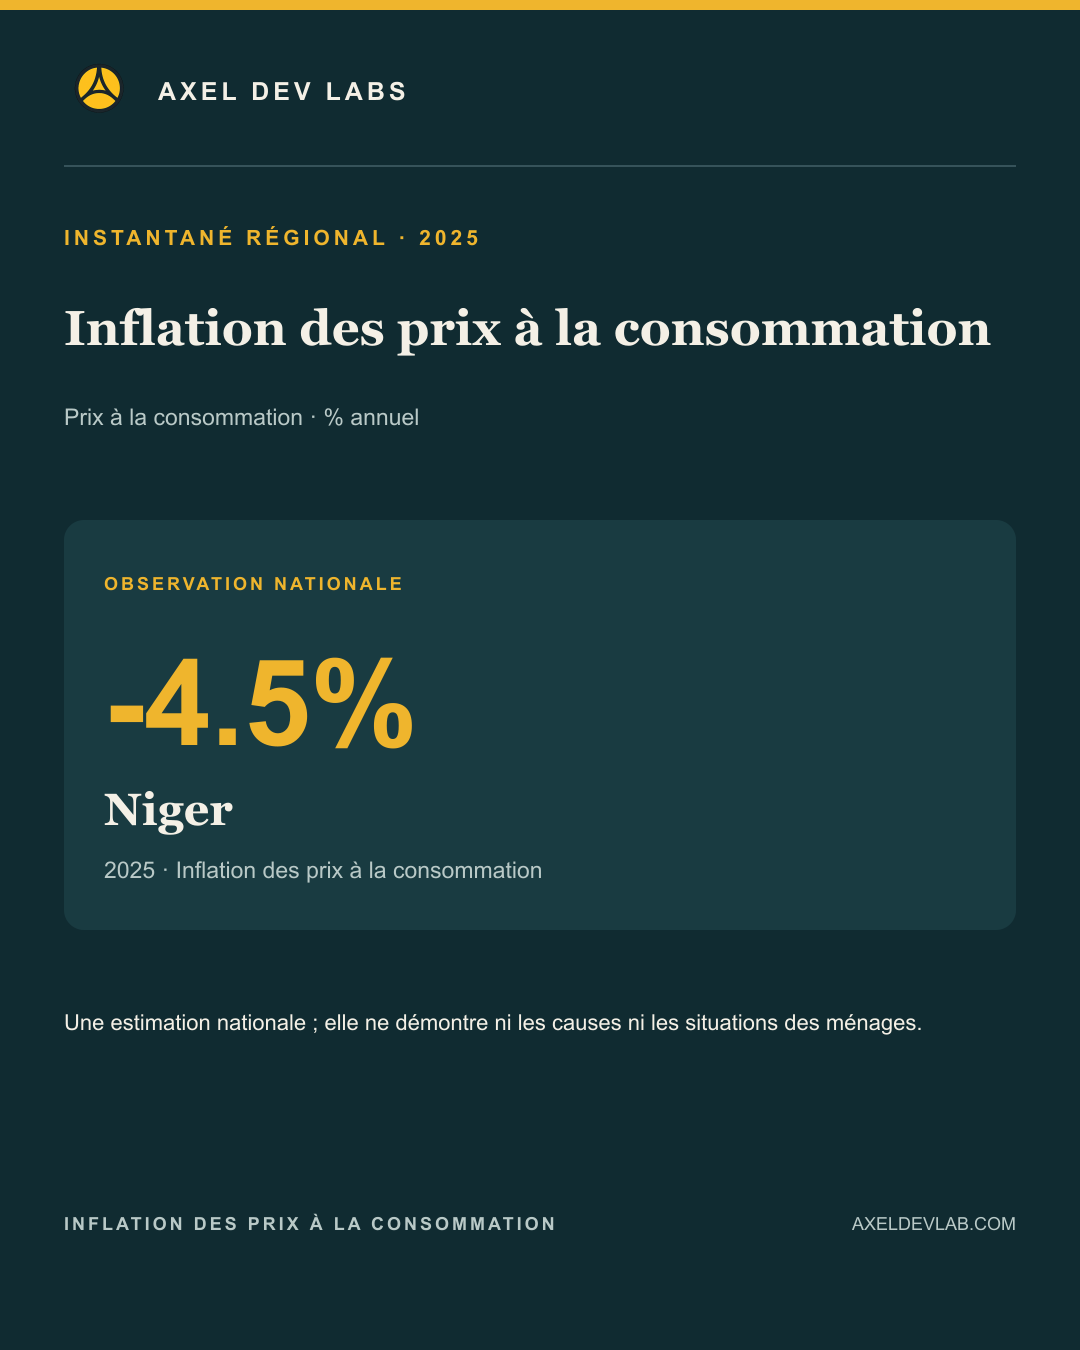
Inflation des prix à la consommation · résultat régional

Inflation la plus faible (déflation) : Niger -4.5% (2025).

Une observation nationale ne démontre ni les causes ni les situations des ménages.

Quelles données locales permettraient d’expliquer cette tendance nationale ?

Suivez Axel Dev Lab pour la prochaine carte de données.

More information and data

Read the complete edition

Adg Social Post
Inflation des prix à la consommation · 2025

Carte pour les réseaux sociaux · support promotionnel

Cette image et sa légende sont des supports courts de diffusion sur les réseaux sociaux. Ils sont distincts du contenu éditorial complet et ne le remplacent pas.

Inflation des prix à la consommation · 2025

Comparez les observations disponibles pour les pays ouest-africains.

Les valeurs nationales ne montrent pas les écarts à l’intérieur des pays.

Read this data brief: https://library.axeldevlab.com/node/290

More information and data

Read the complete edition

Adg Social Post
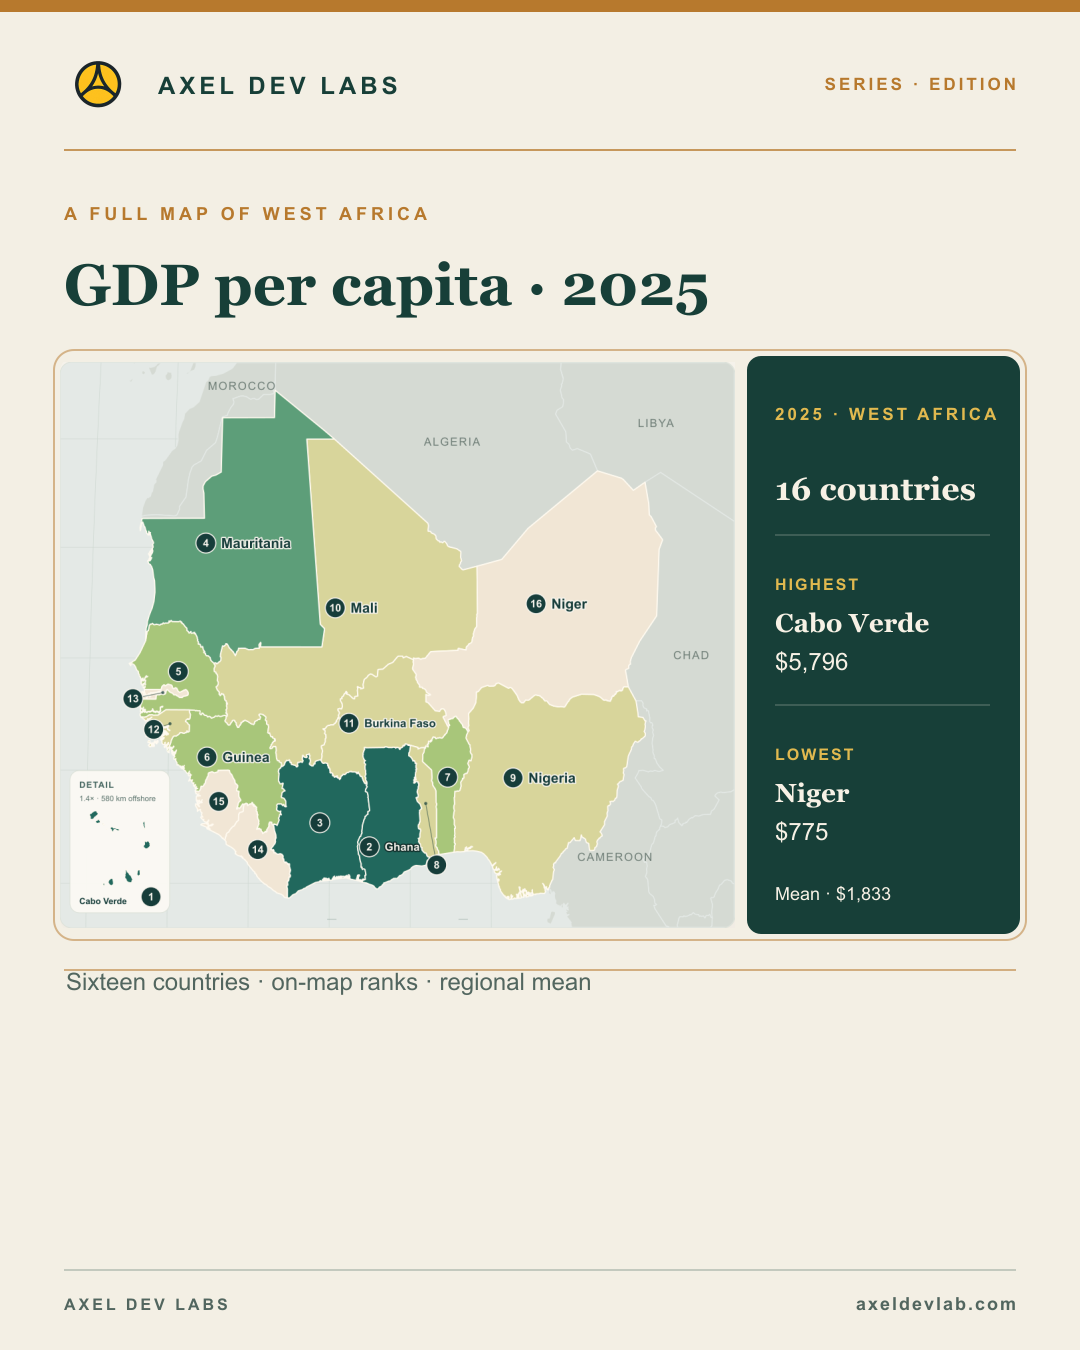
GDP per capita · 2025

Social media card · promotional asset

This image and caption are short-form social distribution assets. They are separate from the full editorial content and do not replace it.

GDP per capita · 2025

Sixteen countries · on-map ranks · regional mean

Regional mean · $1,833. Sixteen countries are ranked on the map.

How has this gap changed over time?

Explore the full ADG edition: https://library.axeldevlab.com/library/editions/meridian-maps/en

More information and data

Read the complete edition

Adg Social Post
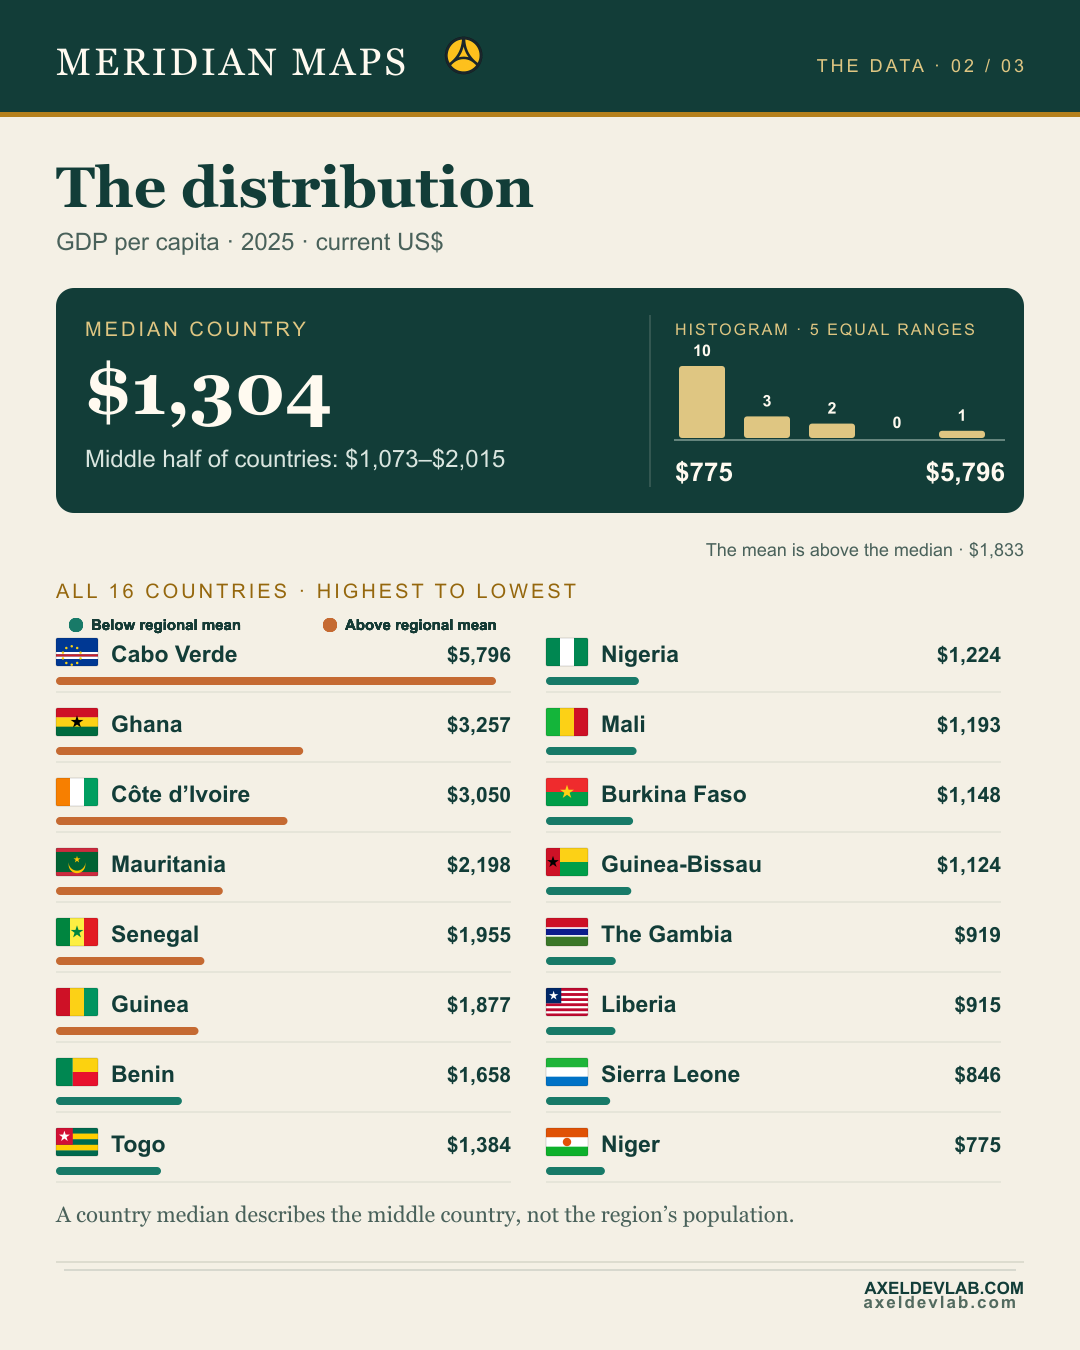
The distribution

Social media card · promotional asset

This image and caption are short-form social distribution assets. They are separate from the full editorial content and do not replace it.

The distribution

Sixteen countries; the median is $1,304 and the mean is $1,833.

Flags identify countries; orange marks above the regional mean and teal marks below it.

Which countries set the range?

Read the full ADG edition: https://library.axeldevlab.com/library/editions/meridian-maps/en

More information and data

Read the complete edition

Adg Social Post
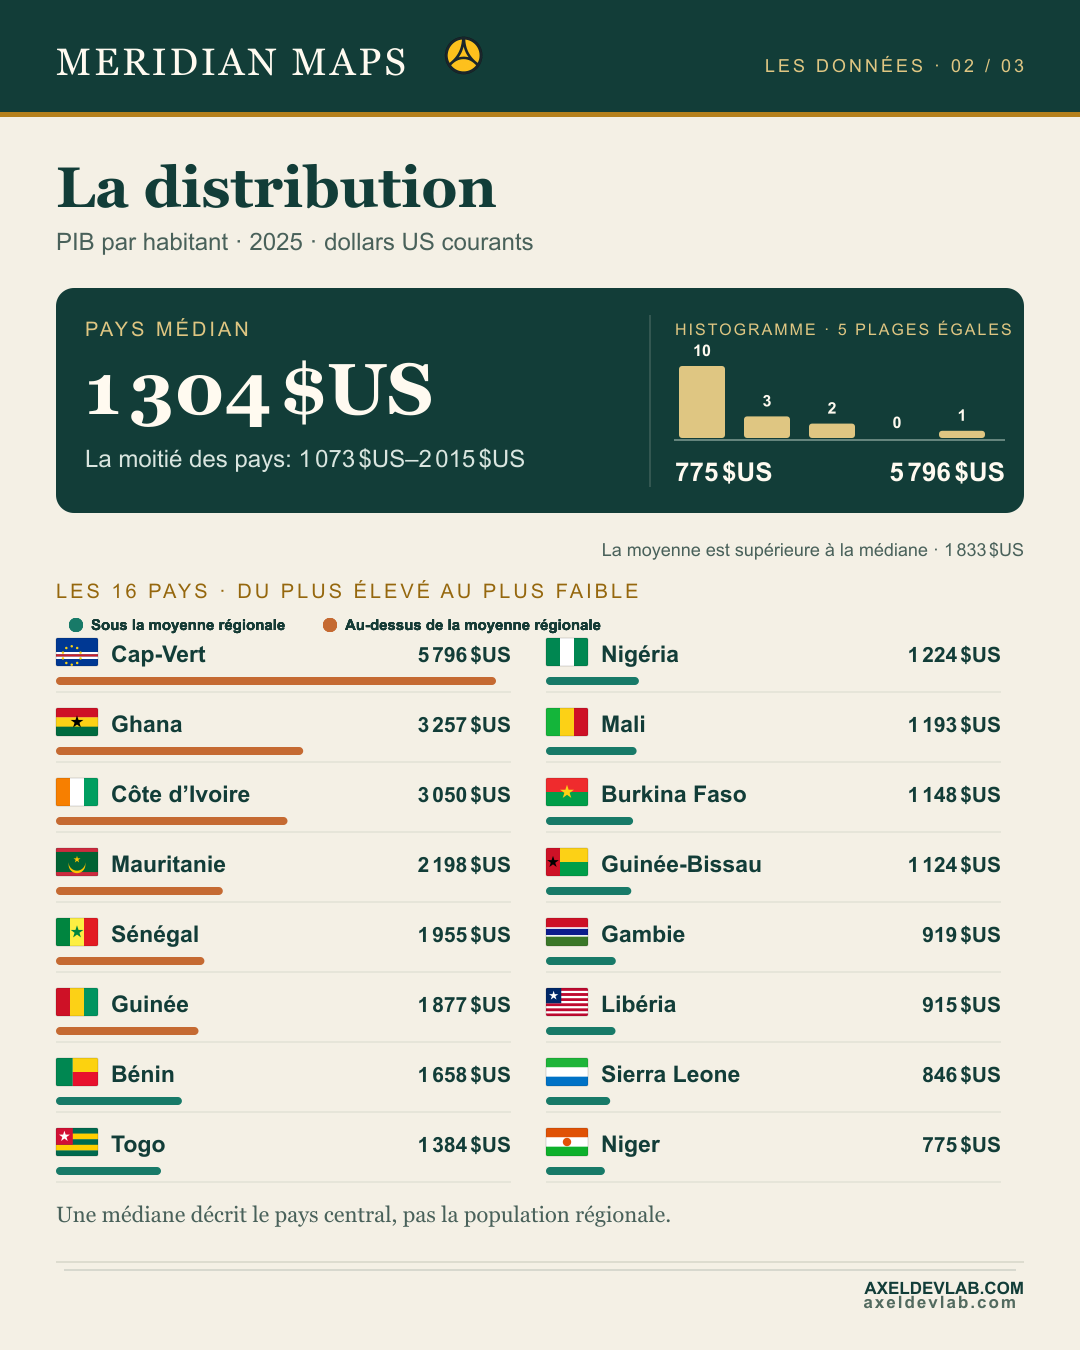
La distribution

Carte pour les réseaux sociaux · support promotionnel

Cette image et sa légende sont des supports courts de diffusion sur les réseaux sociaux. Ils sont distincts du contenu éditorial complet et ne le remplacent pas.

La distribution

Seize pays ; la médiane est de 1 304 $US et la moyenne de 1 833 $US.

Les drapeaux identifient les pays ; l’orange indique une valeur supérieure à la moyenne régionale et le vert canard une valeur inférieure.

Quels pays définissent l’étendue ?

Read the full ADG edition: https://library.axeldevlab.com/fr/library/editions/meridian-maps/fr

More information and data

Read the complete edition

Adg Social Post
West Africa GDP per capita · 2025

Social media card · promotional asset

This image and caption are short-form social distribution assets. They are separate from the full editorial content and do not replace it.

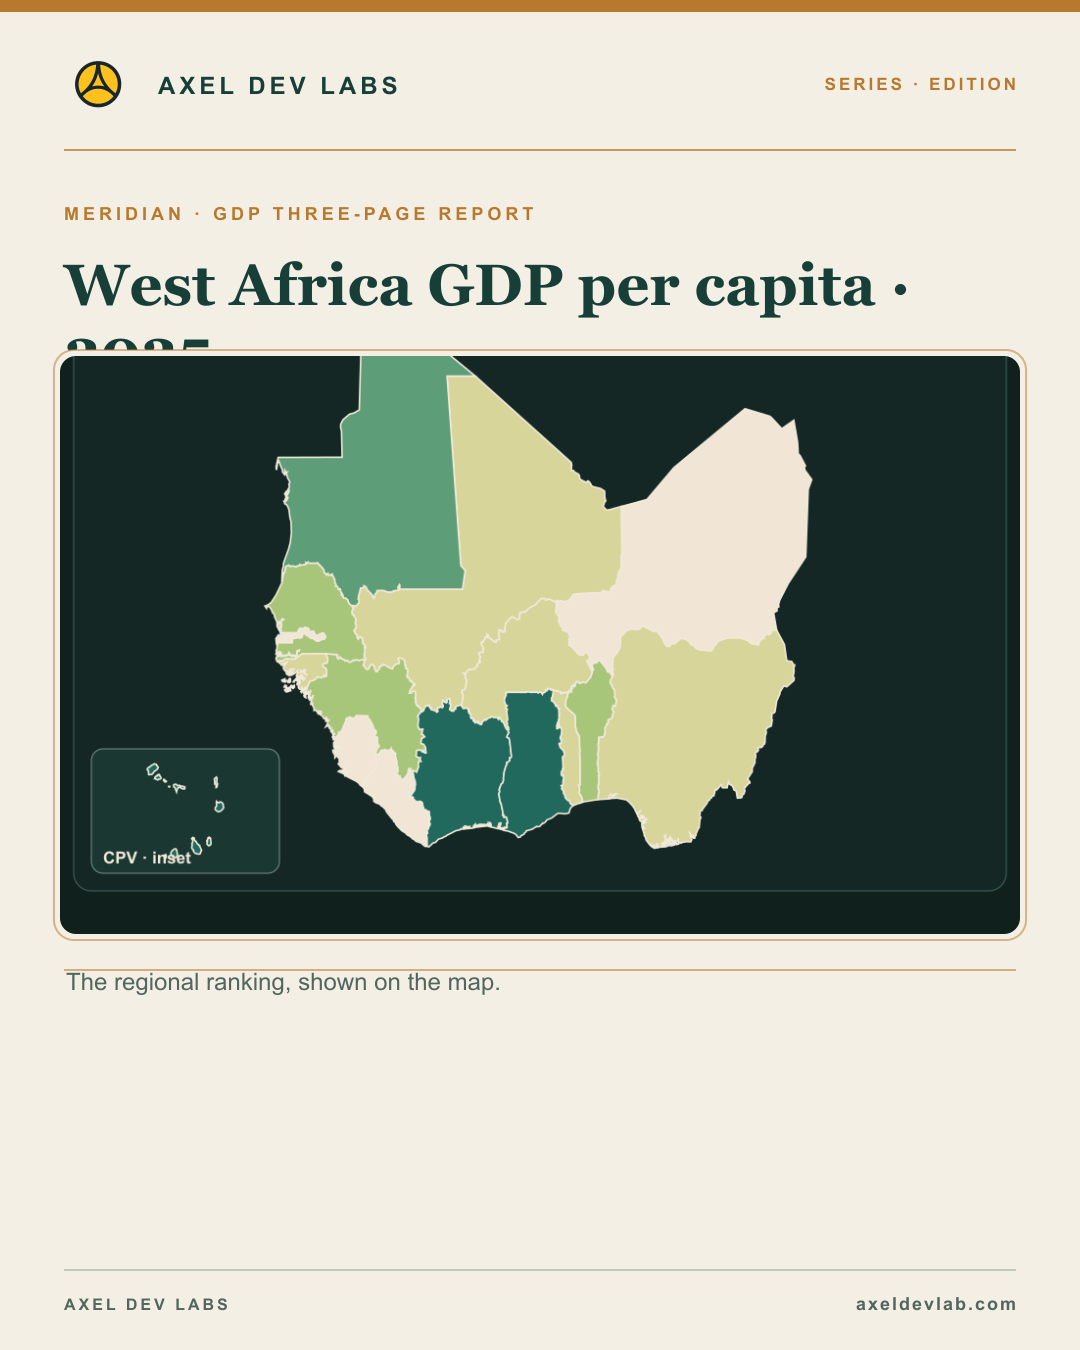
West Africa GDP per capita · 2025

The regional ranking, shown on the map.

16-country comparison in current US dollars.

What does the regional mean conceal?

Explore the maps, data and methodology: https://library.axeldevlab.com/library/maps-visualizations

More information and data

Read the complete edition

No results found

Try adjusting your search or filters.