Compare shapes without mixing groups.
Maps Visualization

Comparer des formes sans mélanger les groupes.

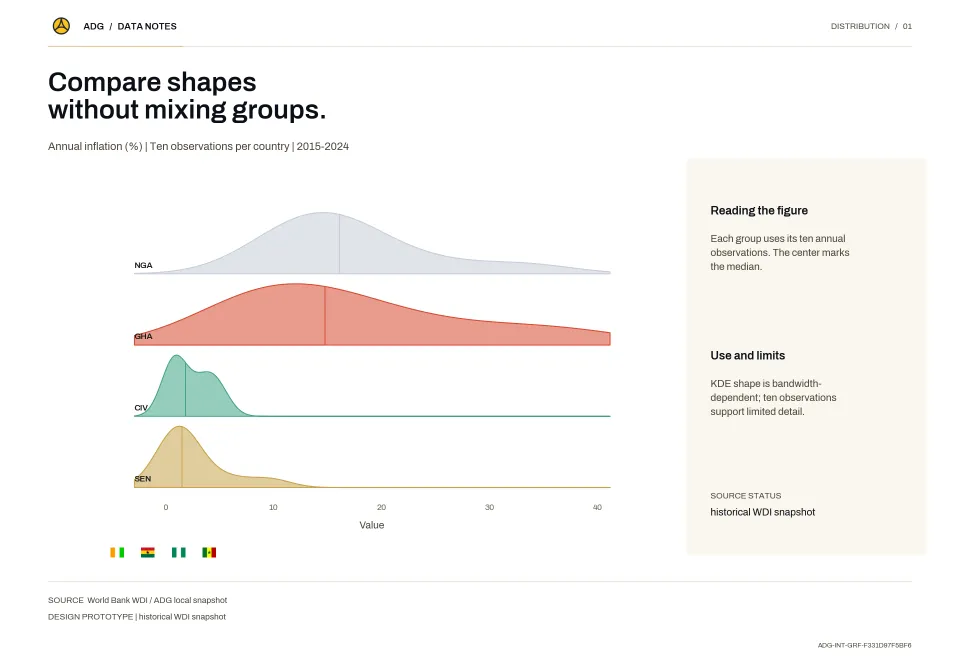
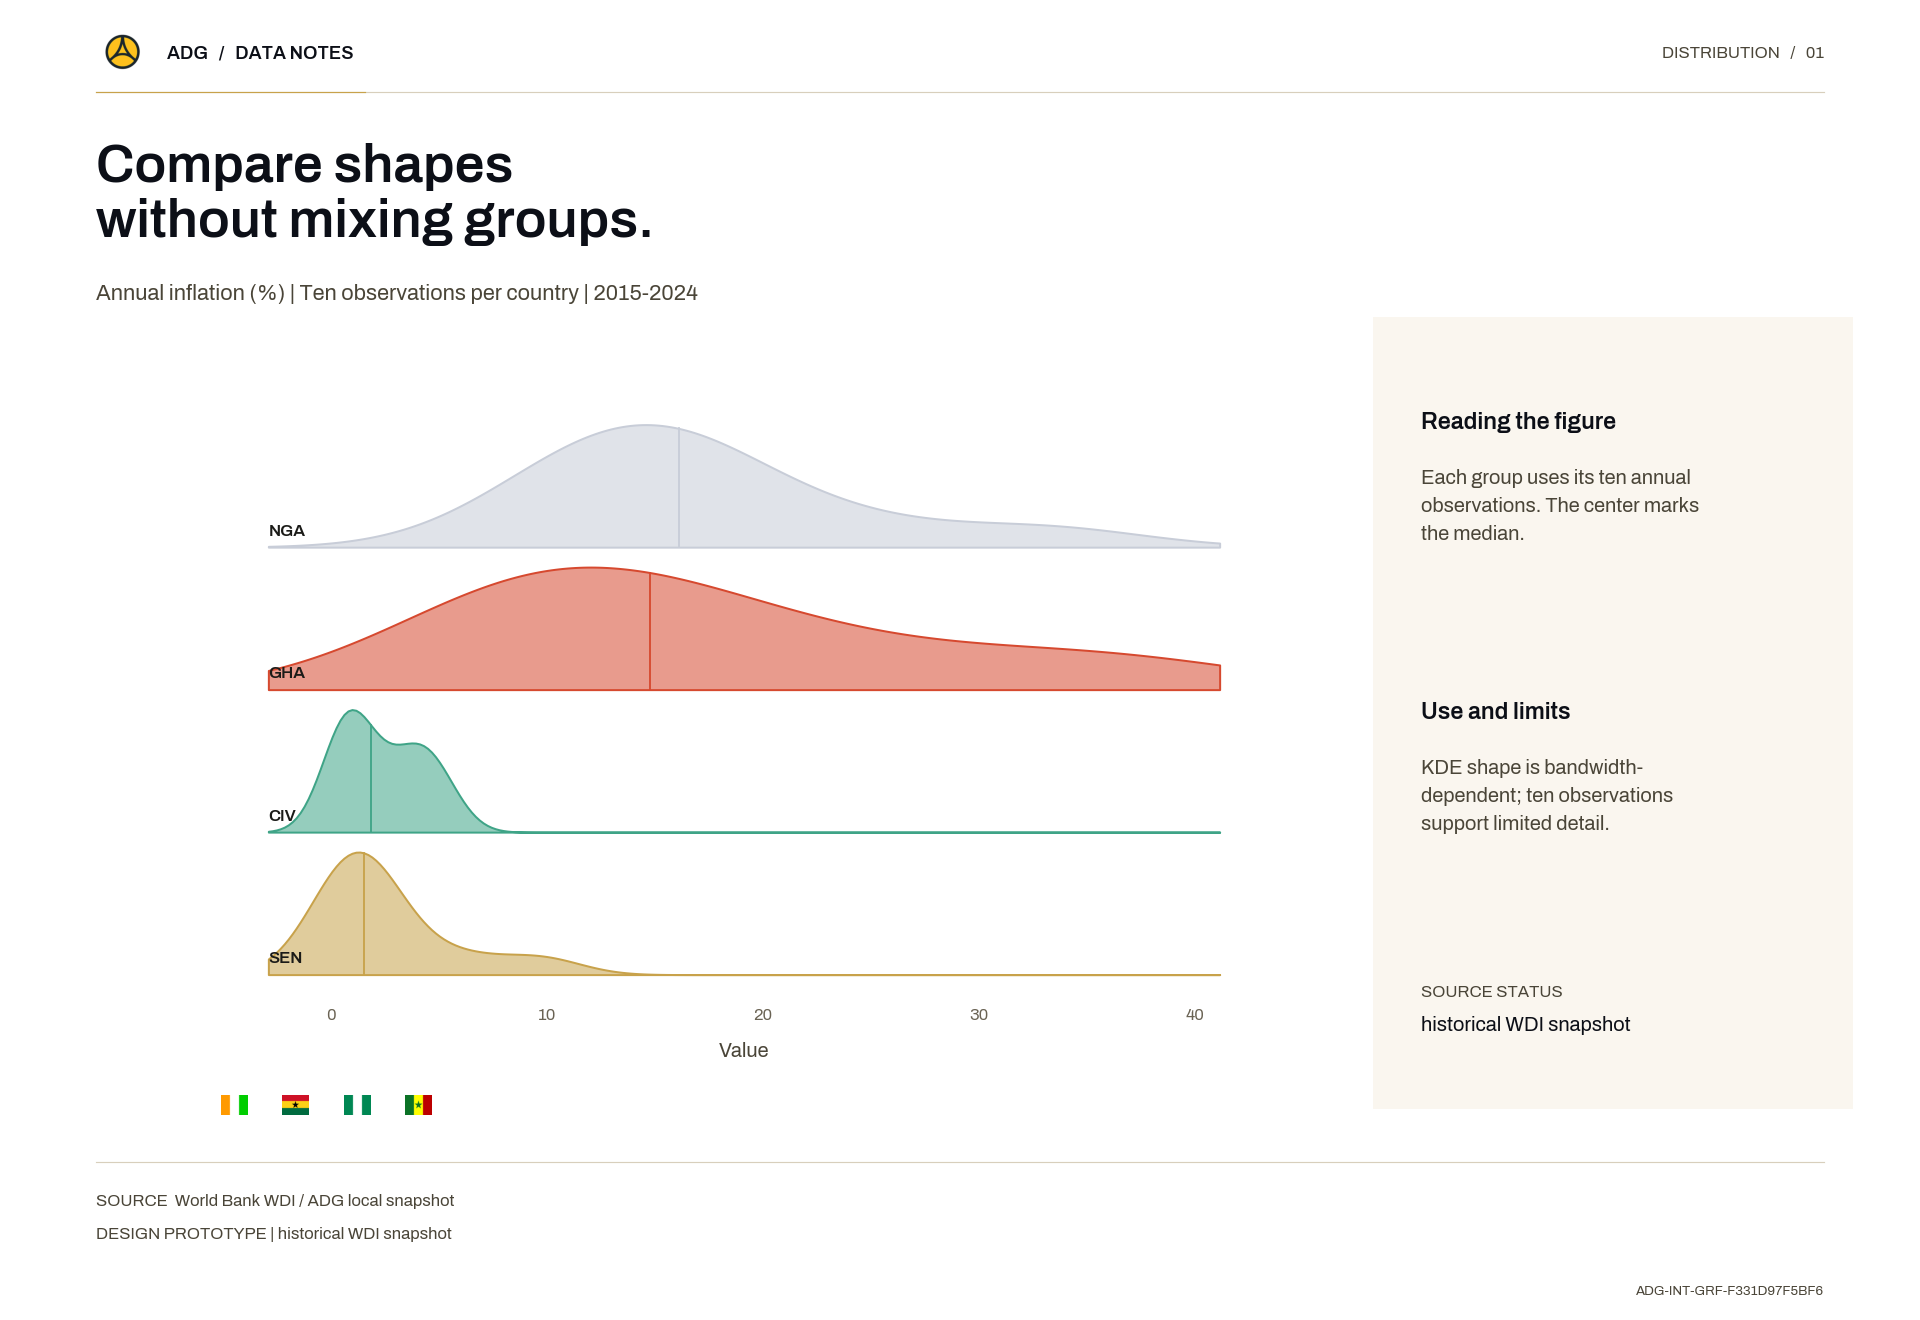
Each group uses its ten annual observations. The center marks the median.Data source: World Bank WDI / ADG local snapshotMethod: KDE shape is bandwidth-dependent; ten observations support limited detail.
Description
Chaque groupe utilise ses dix observations annuelles. Le centre marque la médiane.

Each group uses its ten annual observations. The center marks the median.

Data source: World Bank WDI / ADG local snapshot

Method: KDE shape is bandwidth-dependent; ten observations support limited detail.

Publication Date
Visual Type
Thumbnail / Cover Image
Compare shapes without mixing groups.
Methodology
KDE shape is bandwidth-dependent; ten observations support limited detail.
Four measurements inside each interval.
Maps Visualization

Quatre mesures à l'intérieur de chaque intervalle.

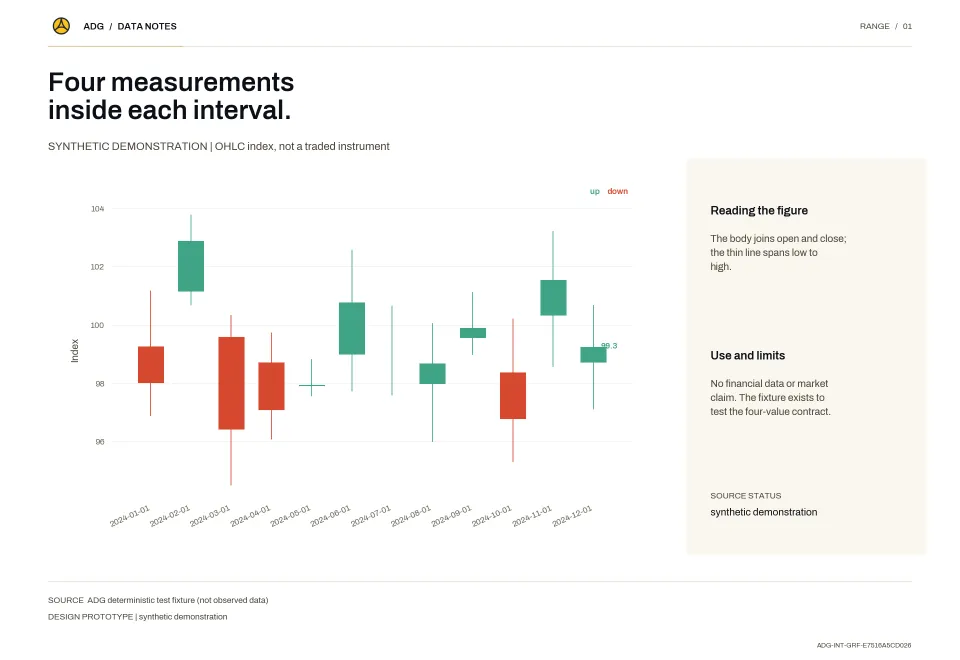
The body joins open and close; the thin line spans low to high.Data source: ADG deterministic test fixture (not observed data)Method: No financial data or market claim. The fixture exists to test the four-value contract.

Description
Le corps relie l'ouverture et la clôture ; le trait fin va du plus bas au plus haut.

The body joins open and close; the thin line spans low to high.

Data source: ADG deterministic test fixture (not observed data)

Method: No financial data or market claim. The fixture exists to test the four-value contract.

Publication Date
Visual Type
Thumbnail / Cover Image
Four measurements inside each interval.
Methodology
No financial data or market claim. The fixture exists to test the four-value contract.
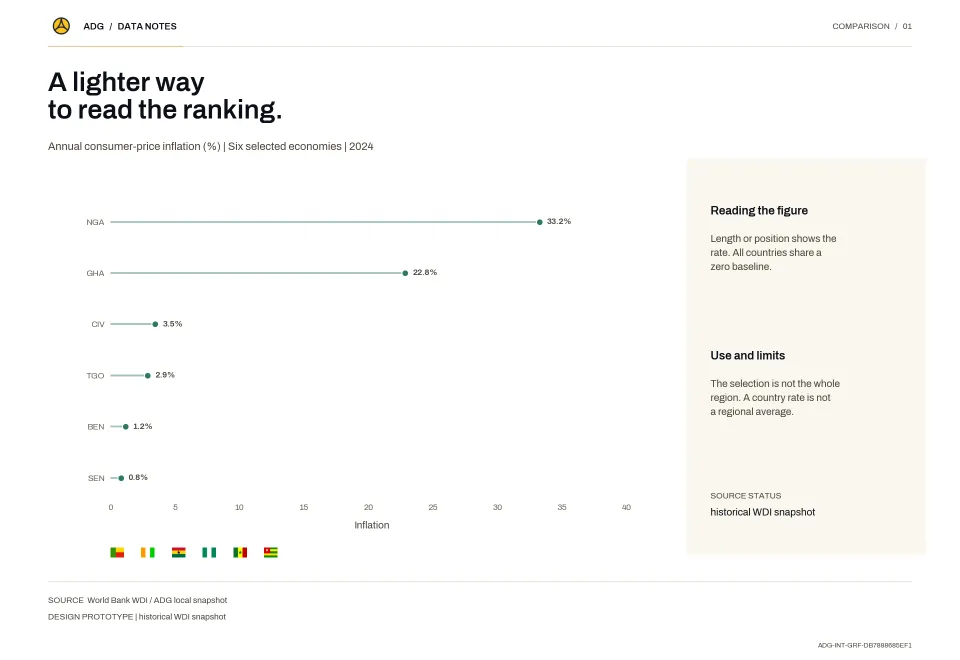
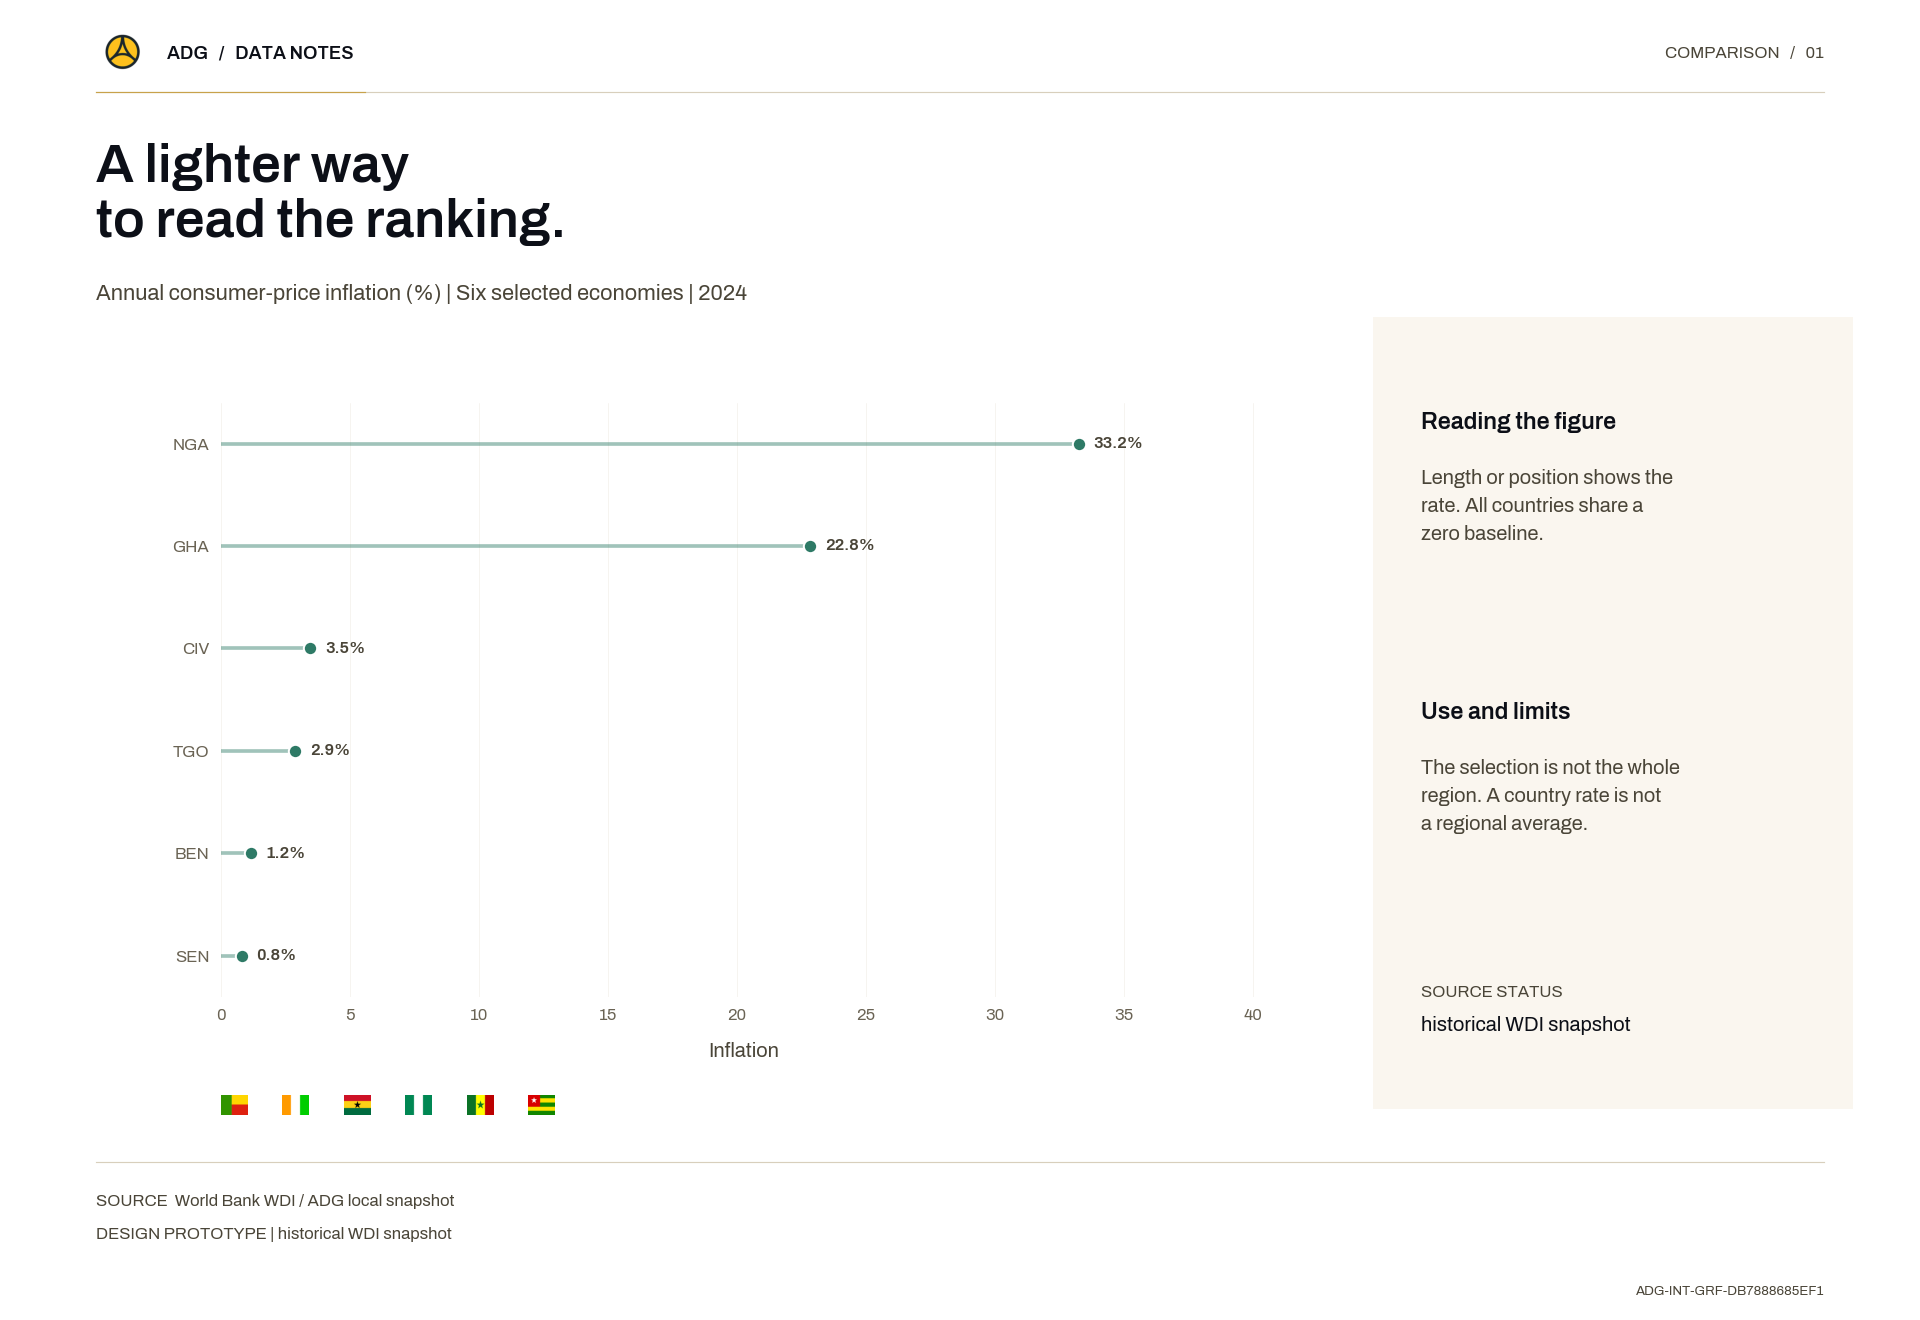
A lighter way to read the ranking.
Maps Visualization

Une lecture plus légère du classement.

Length or position shows the rate. All countries share a zero baseline.Data source: World Bank WDI / ADG local snapshotMethod: The selection is not the whole region. A country rate is not a regional average.

Description
La longueur ou la position indique le taux. Tous les pays partagent une base zéro.

Length or position shows the rate. All countries share a zero baseline.

Data source: World Bank WDI / ADG local snapshot

Method: The selection is not the whole region. A country rate is not a regional average.

Publication Date
Visual Type
Thumbnail / Cover Image
A lighter way to read the ranking.
Methodology
The selection is not the whole region. A country rate is not a regional average.
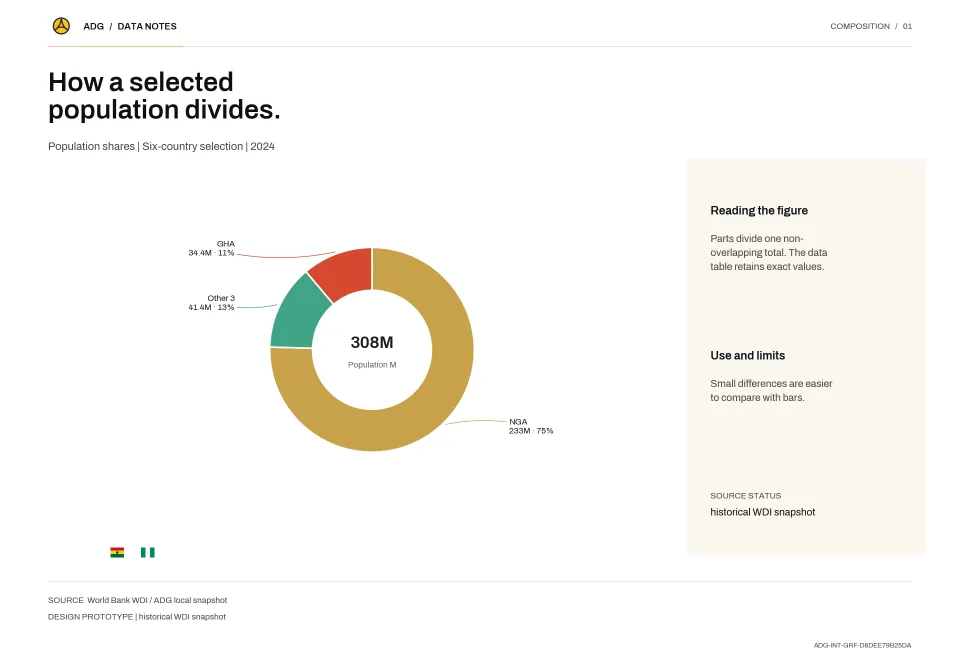
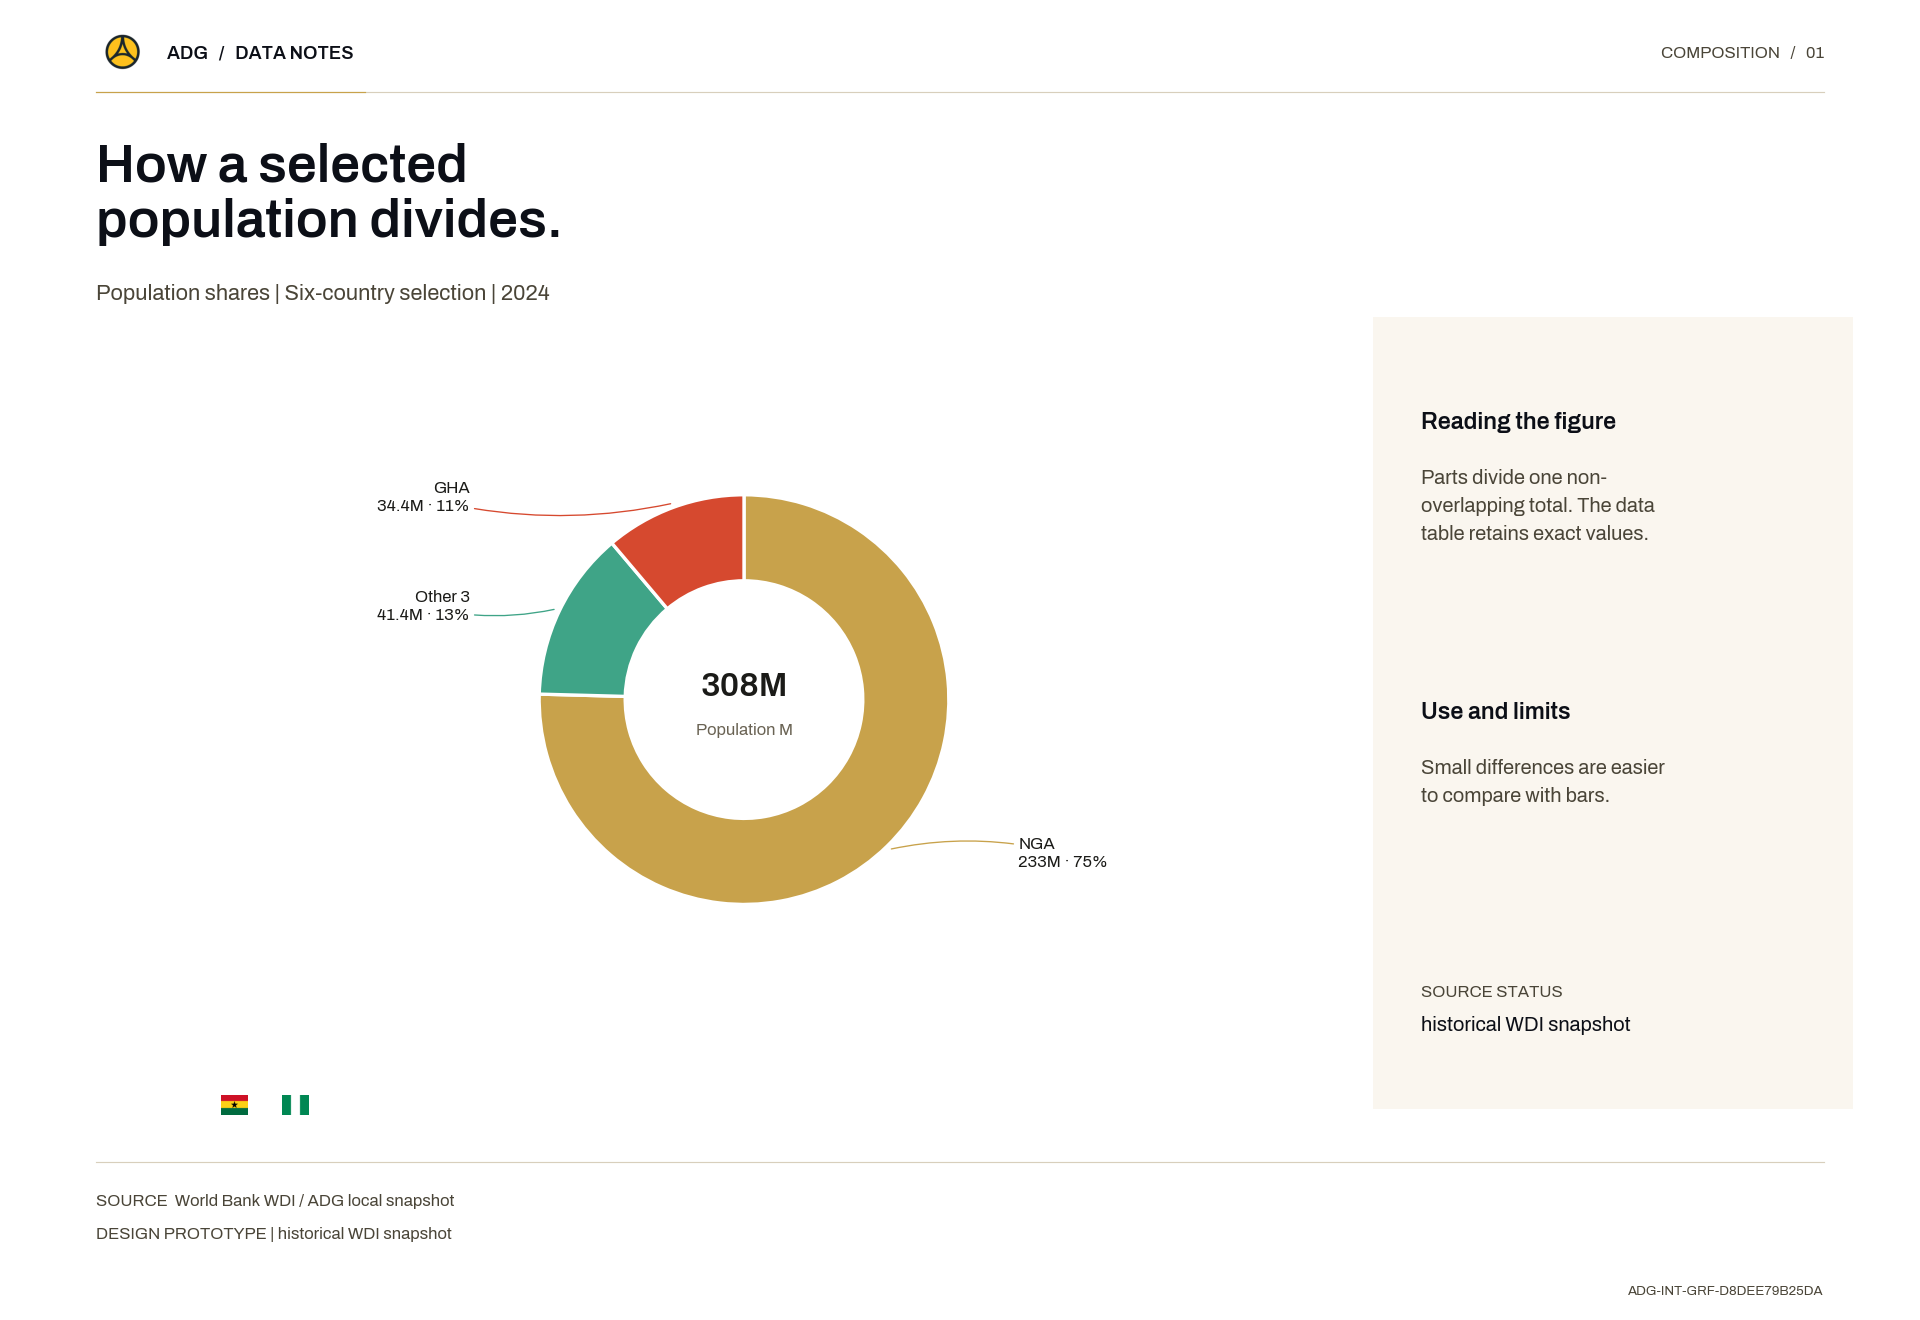
How a selected population divides.
Maps Visualization

Comment se divise une population donnée.

Parts divide one non-overlapping total. The data table retains exact values.Data source: World Bank WDI / ADG local snapshotMethod: Small differences are easier to compare with bars.

Description
Les parts divisent un total unique et sans recouvrement. Le tableau de données conserve les valeurs exactes.

Parts divide one non-overlapping total. The data table retains exact values.

Data source: World Bank WDI / ADG local snapshot

Method: Small differences are easier to compare with bars.

Publication Date
Visual Type
Thumbnail / Cover Image
How a selected population divides.
Methodology
Small differences are easier to compare with bars.
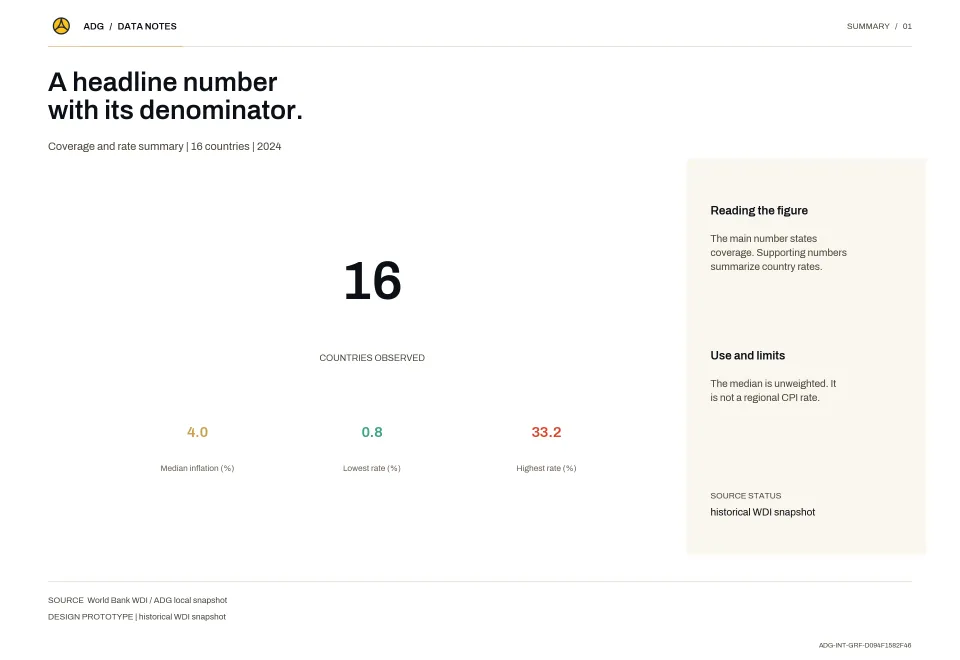
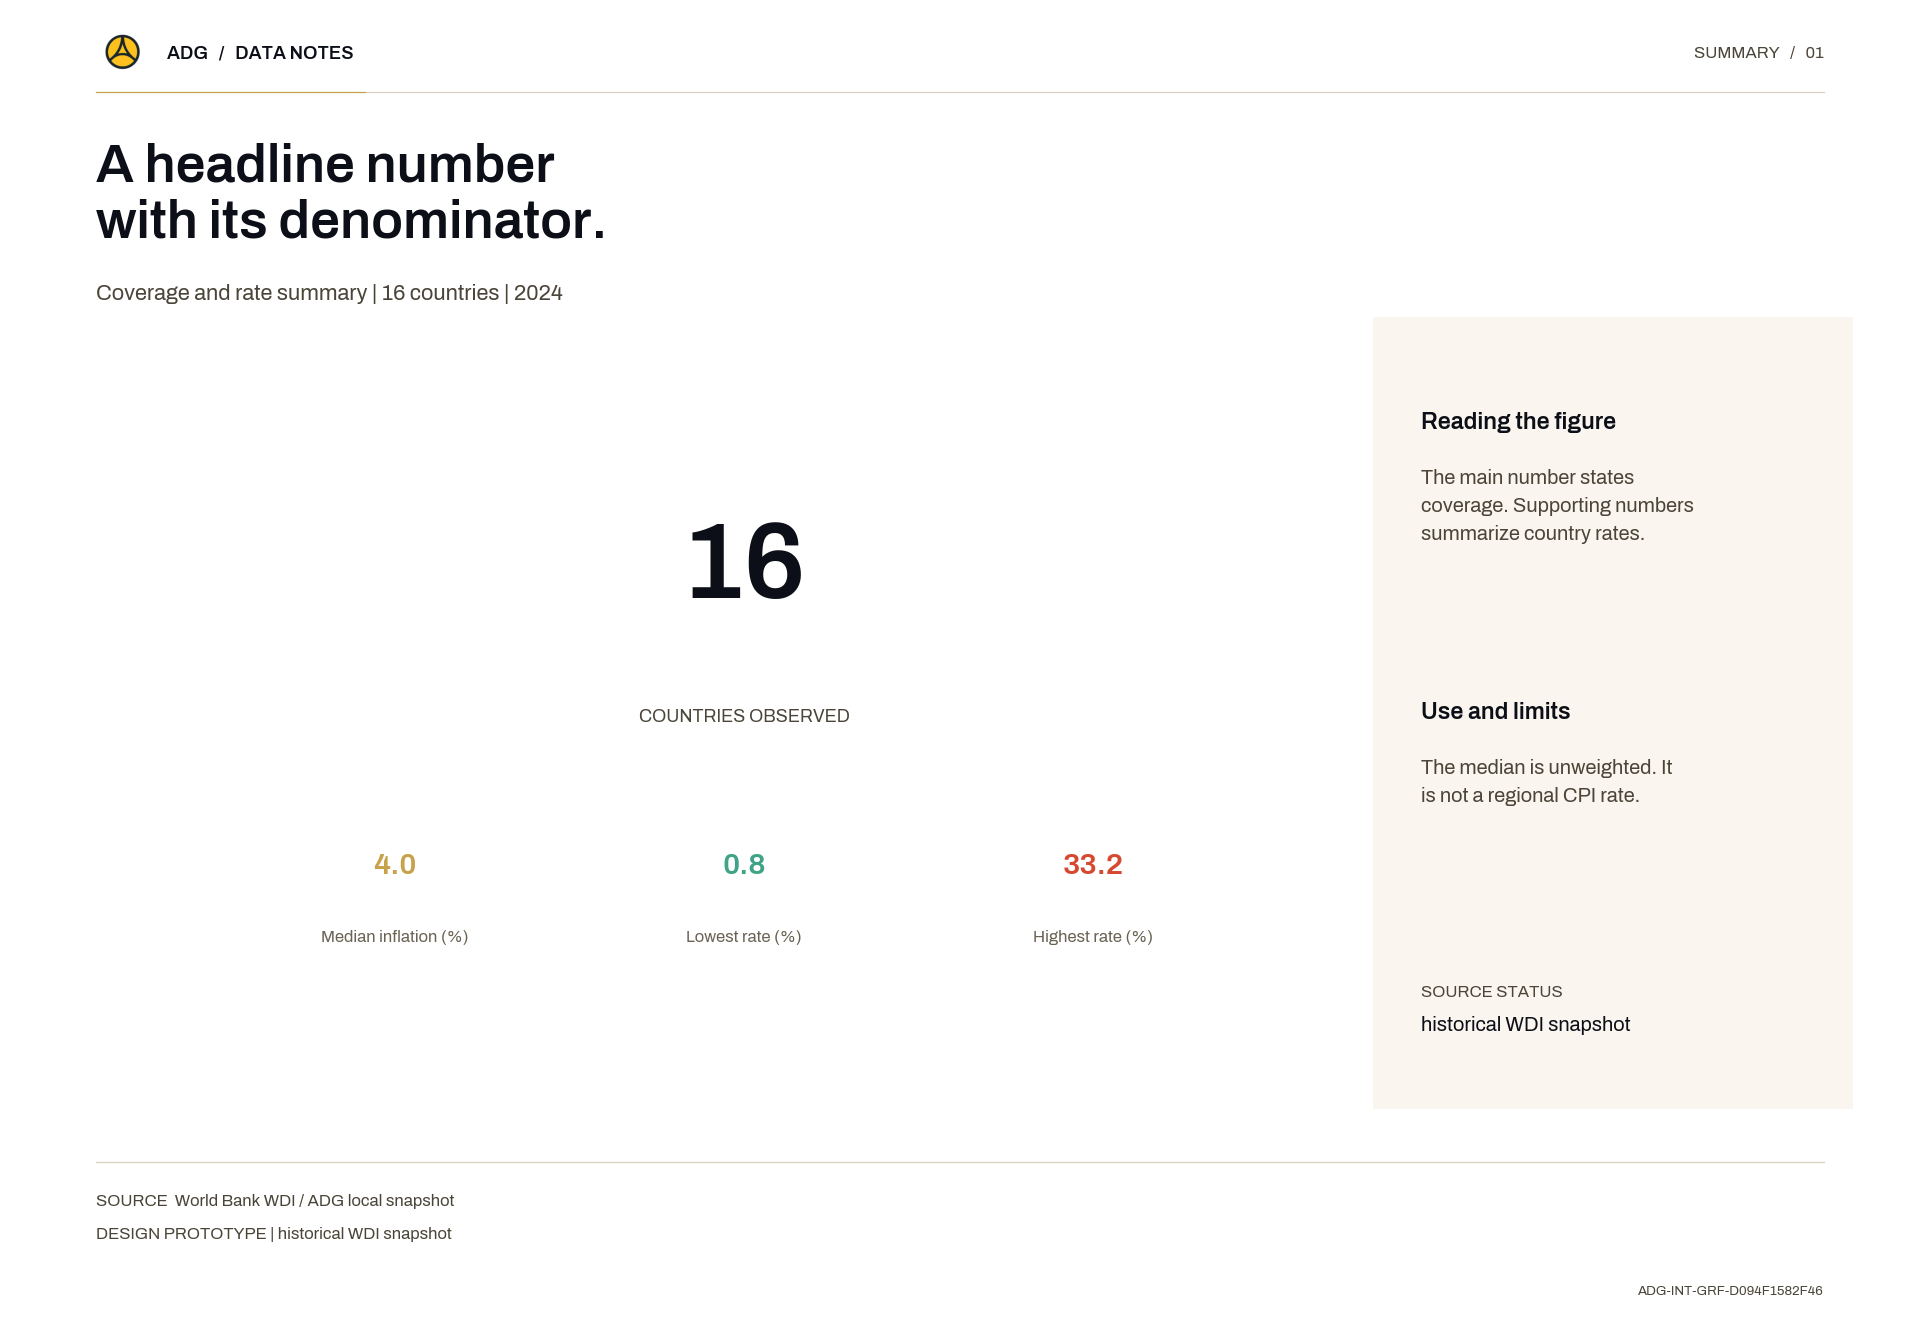
A headline number with its denominator.
Maps Visualization

Un chiffre principal avec son dénominateur.

The main number states coverage. Supporting numbers summarize country rates.Data source: World Bank WDI / ADG local snapshotMethod: The median is unweighted. It is not a regional CPI rate.

Description
Le chiffre principal indique la couverture. Les chiffres d'appui résument les taux par pays.

The main number states coverage. Supporting numbers summarize country rates.

Data source: World Bank WDI / ADG local snapshot

Method: The median is unweighted. It is not a regional CPI rate.

Publication Date
Visual Type
Thumbnail / Cover Image
A headline number with its denominator.
Methodology
The median is unweighted. It is not a regional CPI rate.
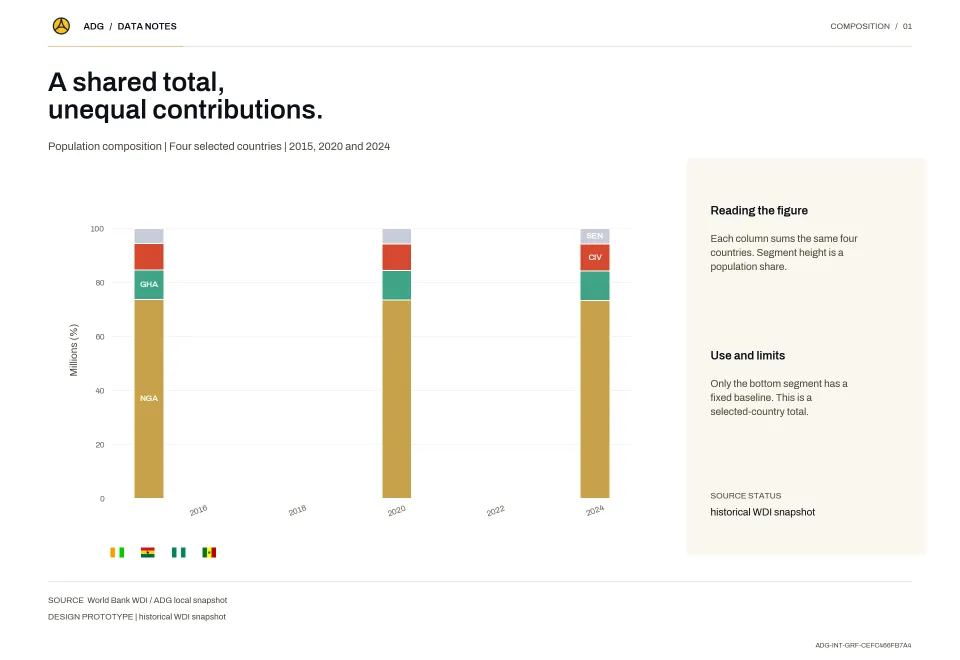
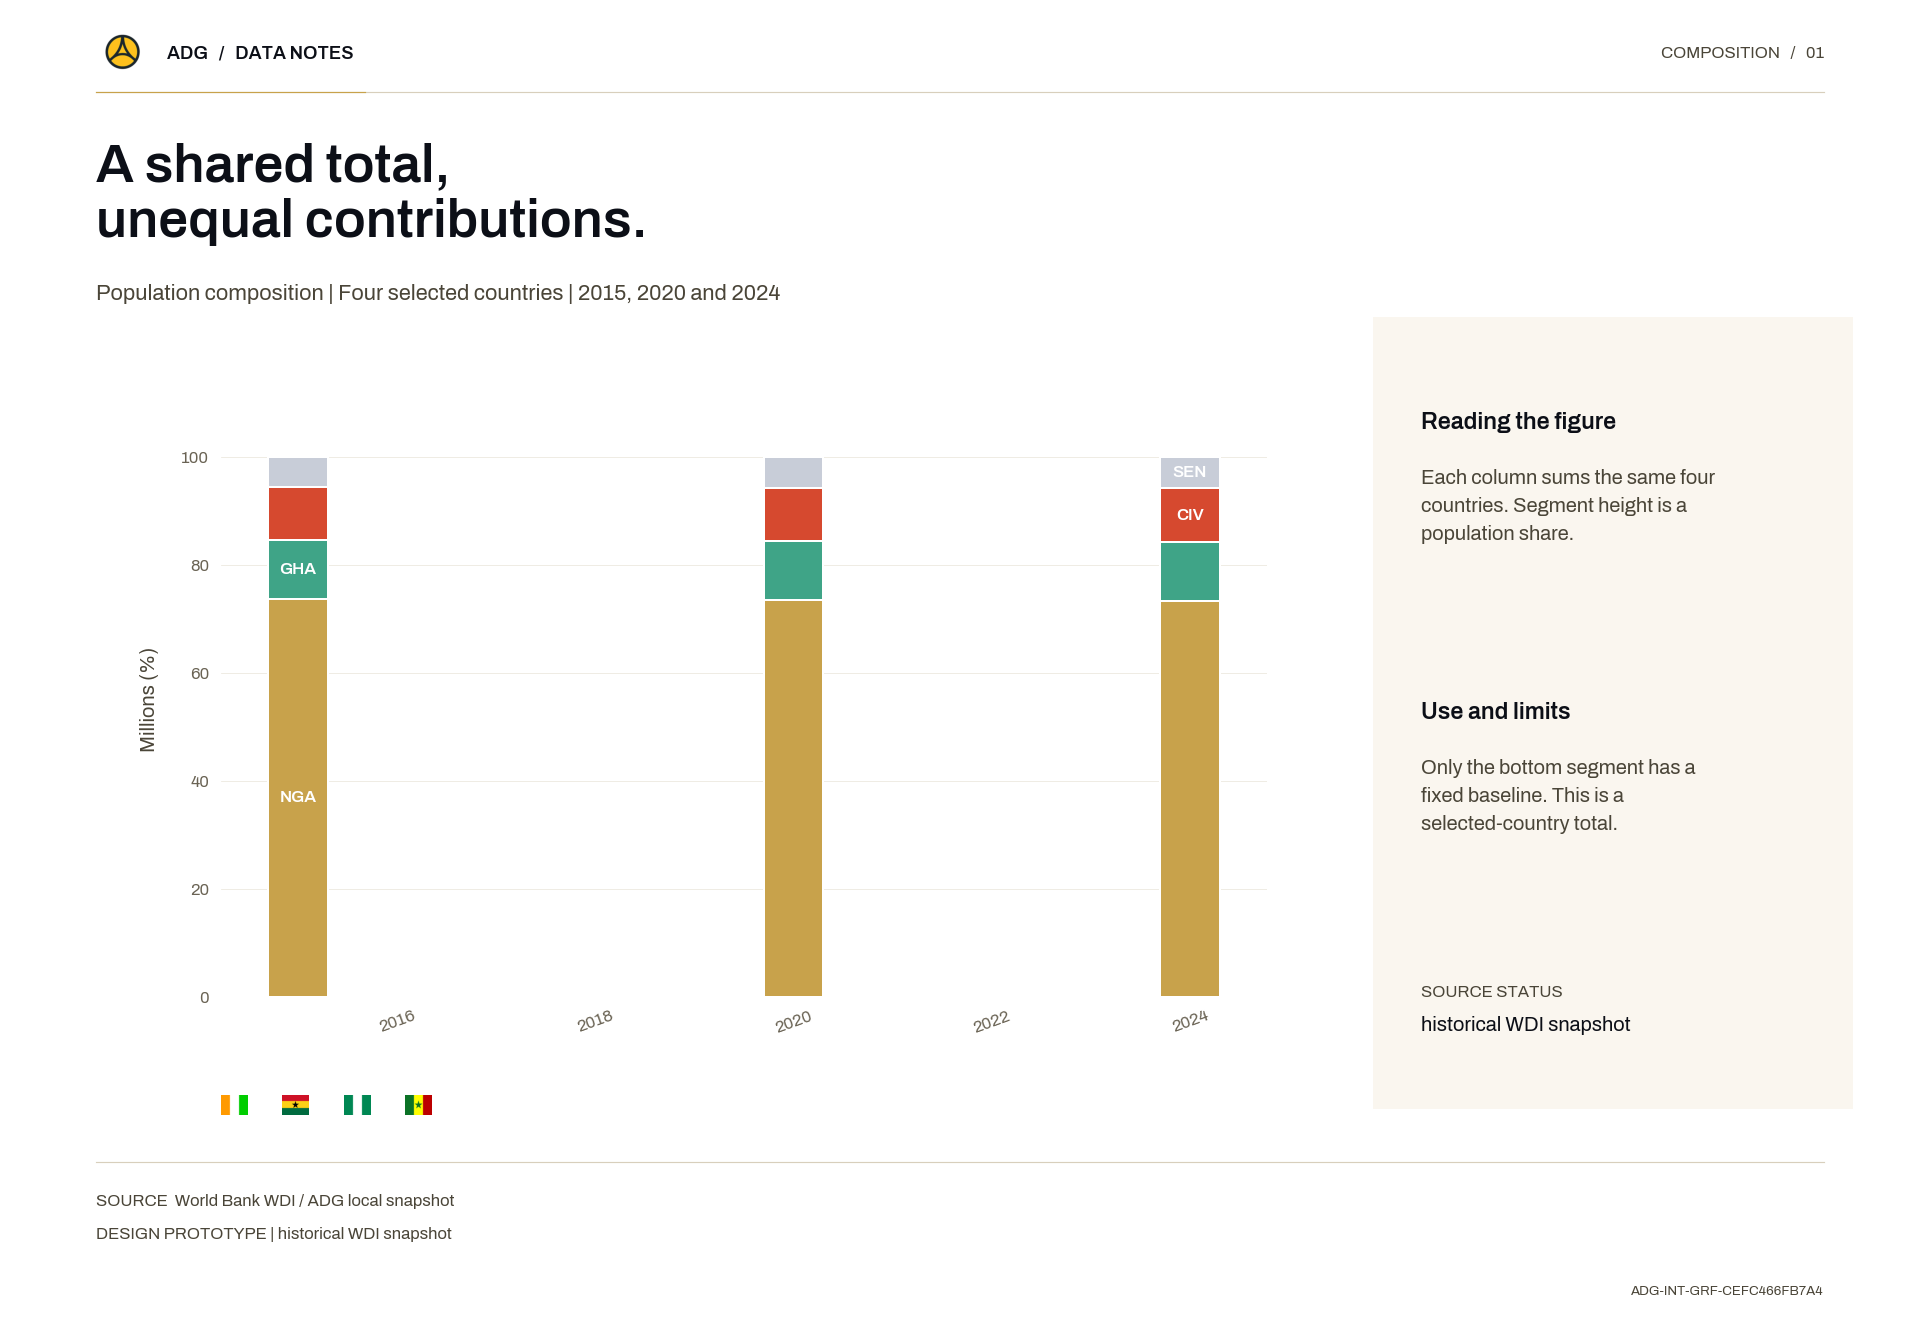
A shared total, unequal contributions.
Maps Visualization

Un total partagé, des contributions inégales.

Each column sums the same four countries. Segment height is a population share.Data source: World Bank WDI / ADG local snapshotMethod: Only the bottom segment has a fixed baseline. This is a selected-country total.

Description
Chaque colonne additionne les quatre mêmes pays. La hauteur d'un segment est une part de population.

Each column sums the same four countries. Segment height is a population share.

Data source: World Bank WDI / ADG local snapshot

Method: Only the bottom segment has a fixed baseline. This is a selected-country total.

Publication Date
Visual Type
Thumbnail / Cover Image
A shared total, unequal contributions.
Methodology
Only the bottom segment has a fixed baseline. This is a selected-country total.
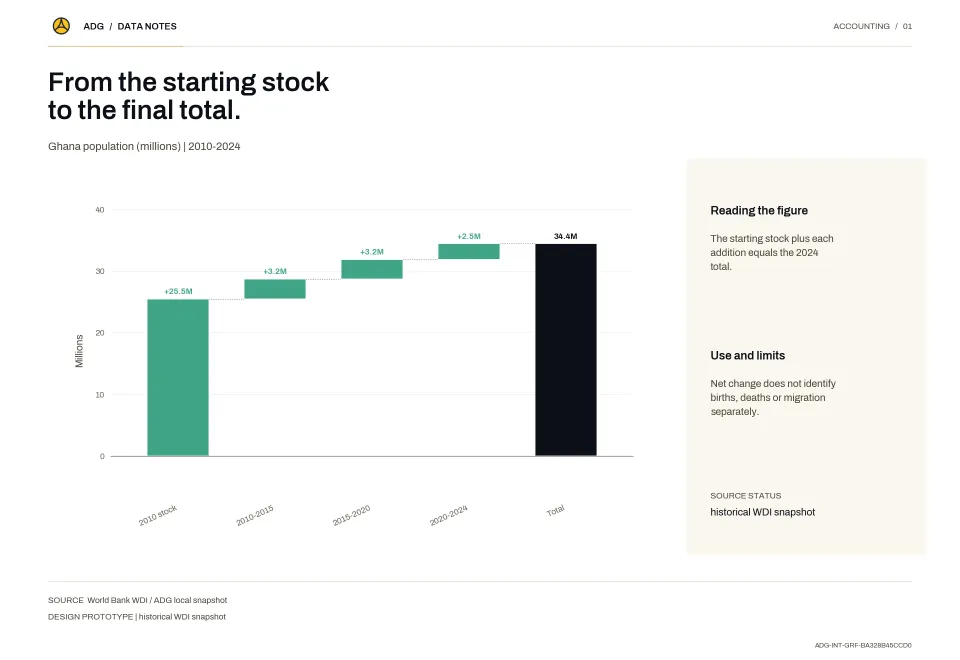
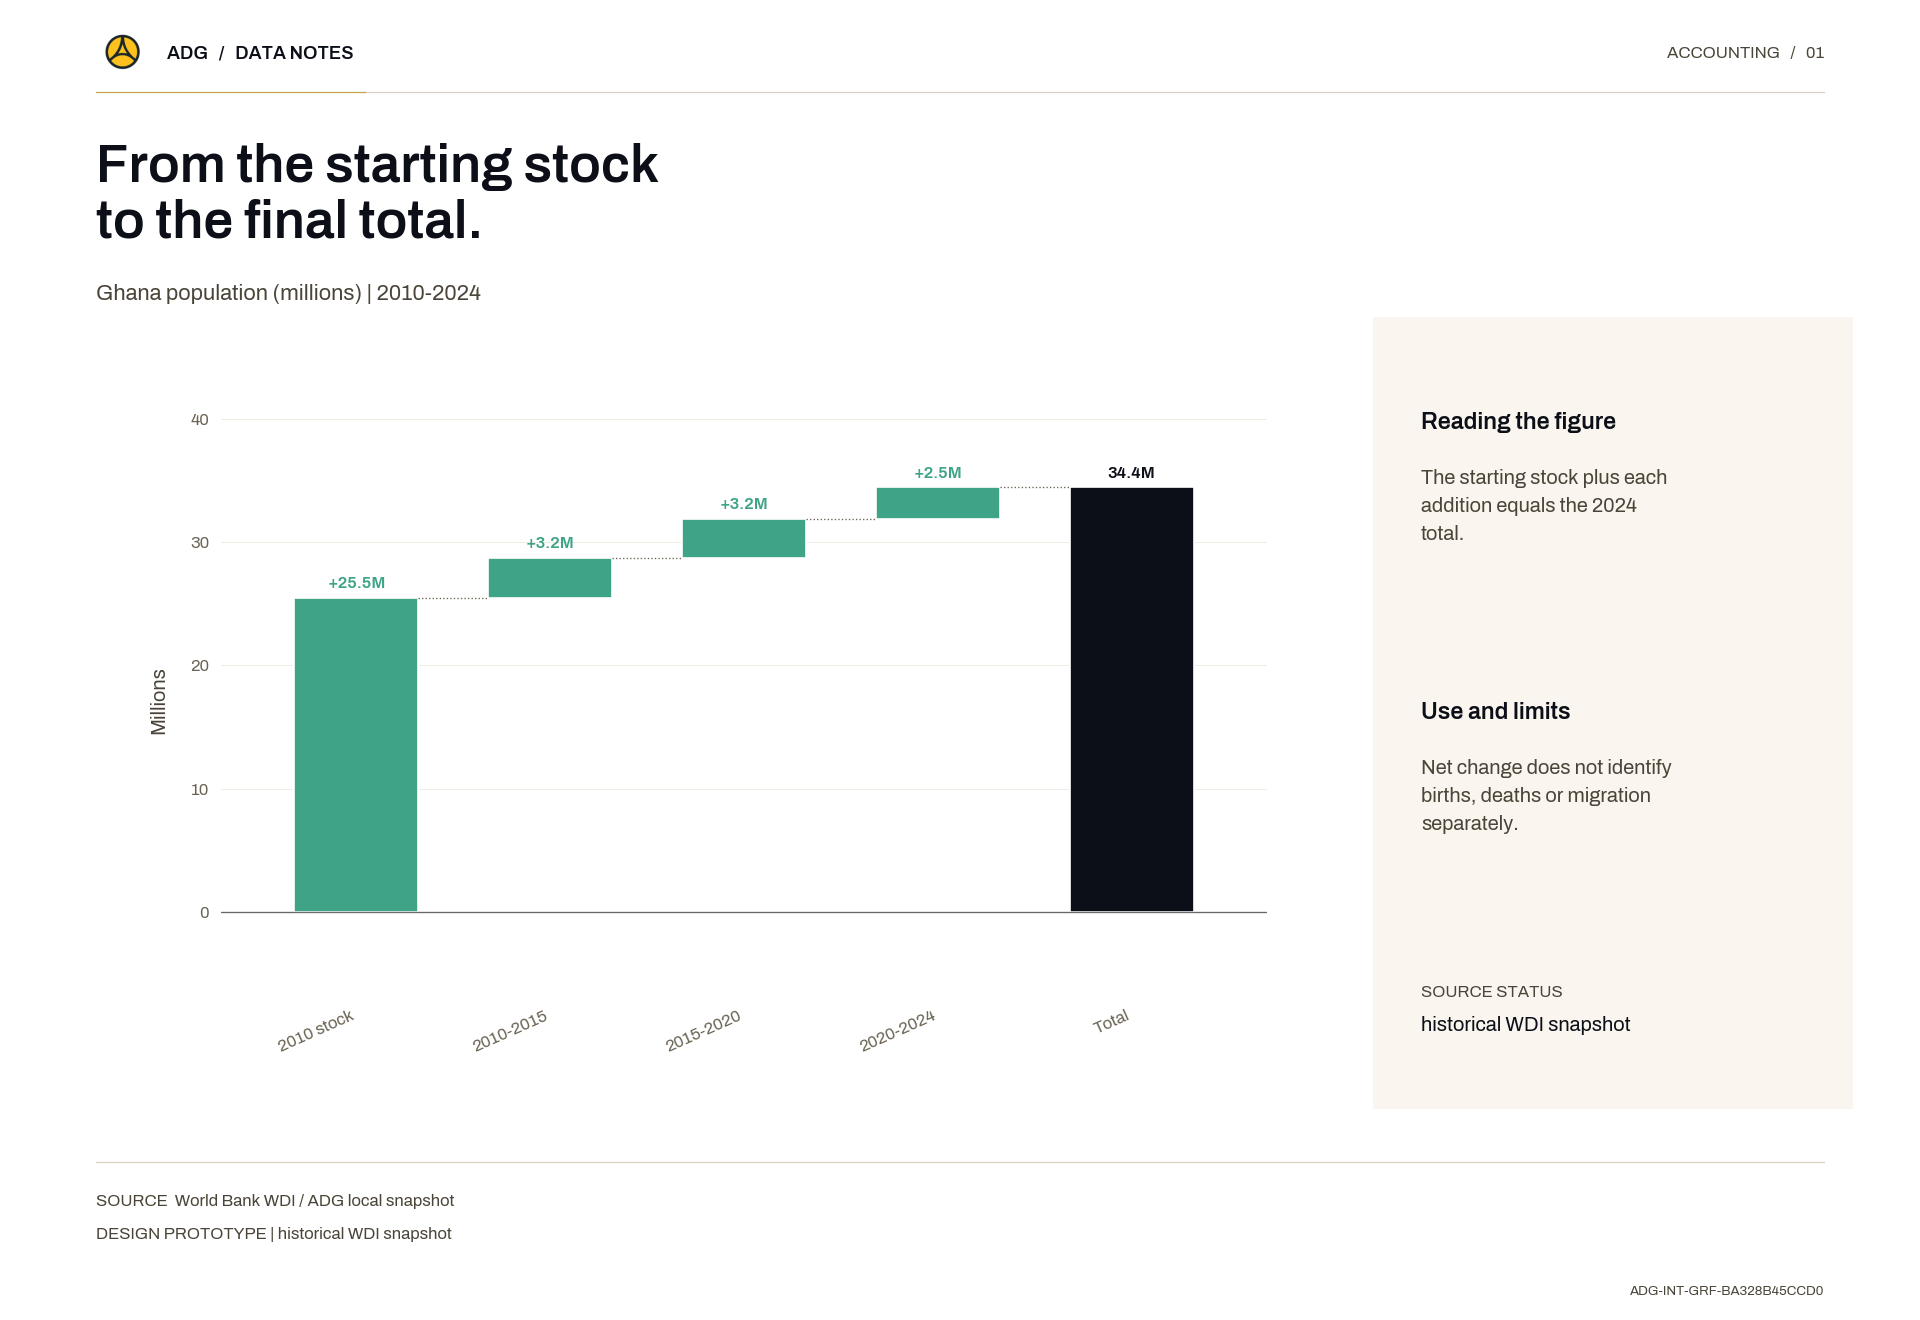
From the starting stock to the final total.
Maps Visualization

Du stock initial au total final.

The starting stock plus each addition equals the 2024 total.Data source: World Bank WDI / ADG local snapshotMethod: Net change does not identify births, deaths or migration separately.

Description
Le stock initial augmenté de chaque apport donne le total de 2024.

The starting stock plus each addition equals the 2024 total.

Data source: World Bank WDI / ADG local snapshot

Method: Net change does not identify births, deaths or migration separately.

Publication Date
Visual Type
Thumbnail / Cover Image
From the starting stock to the final total.
Methodology
Net change does not identify births, deaths or migration separately.
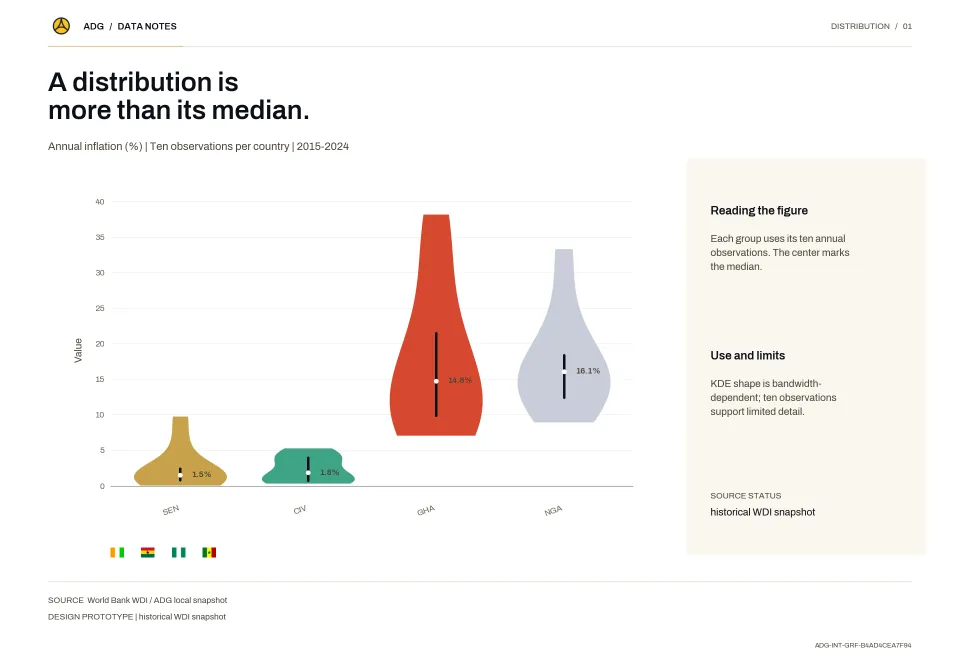
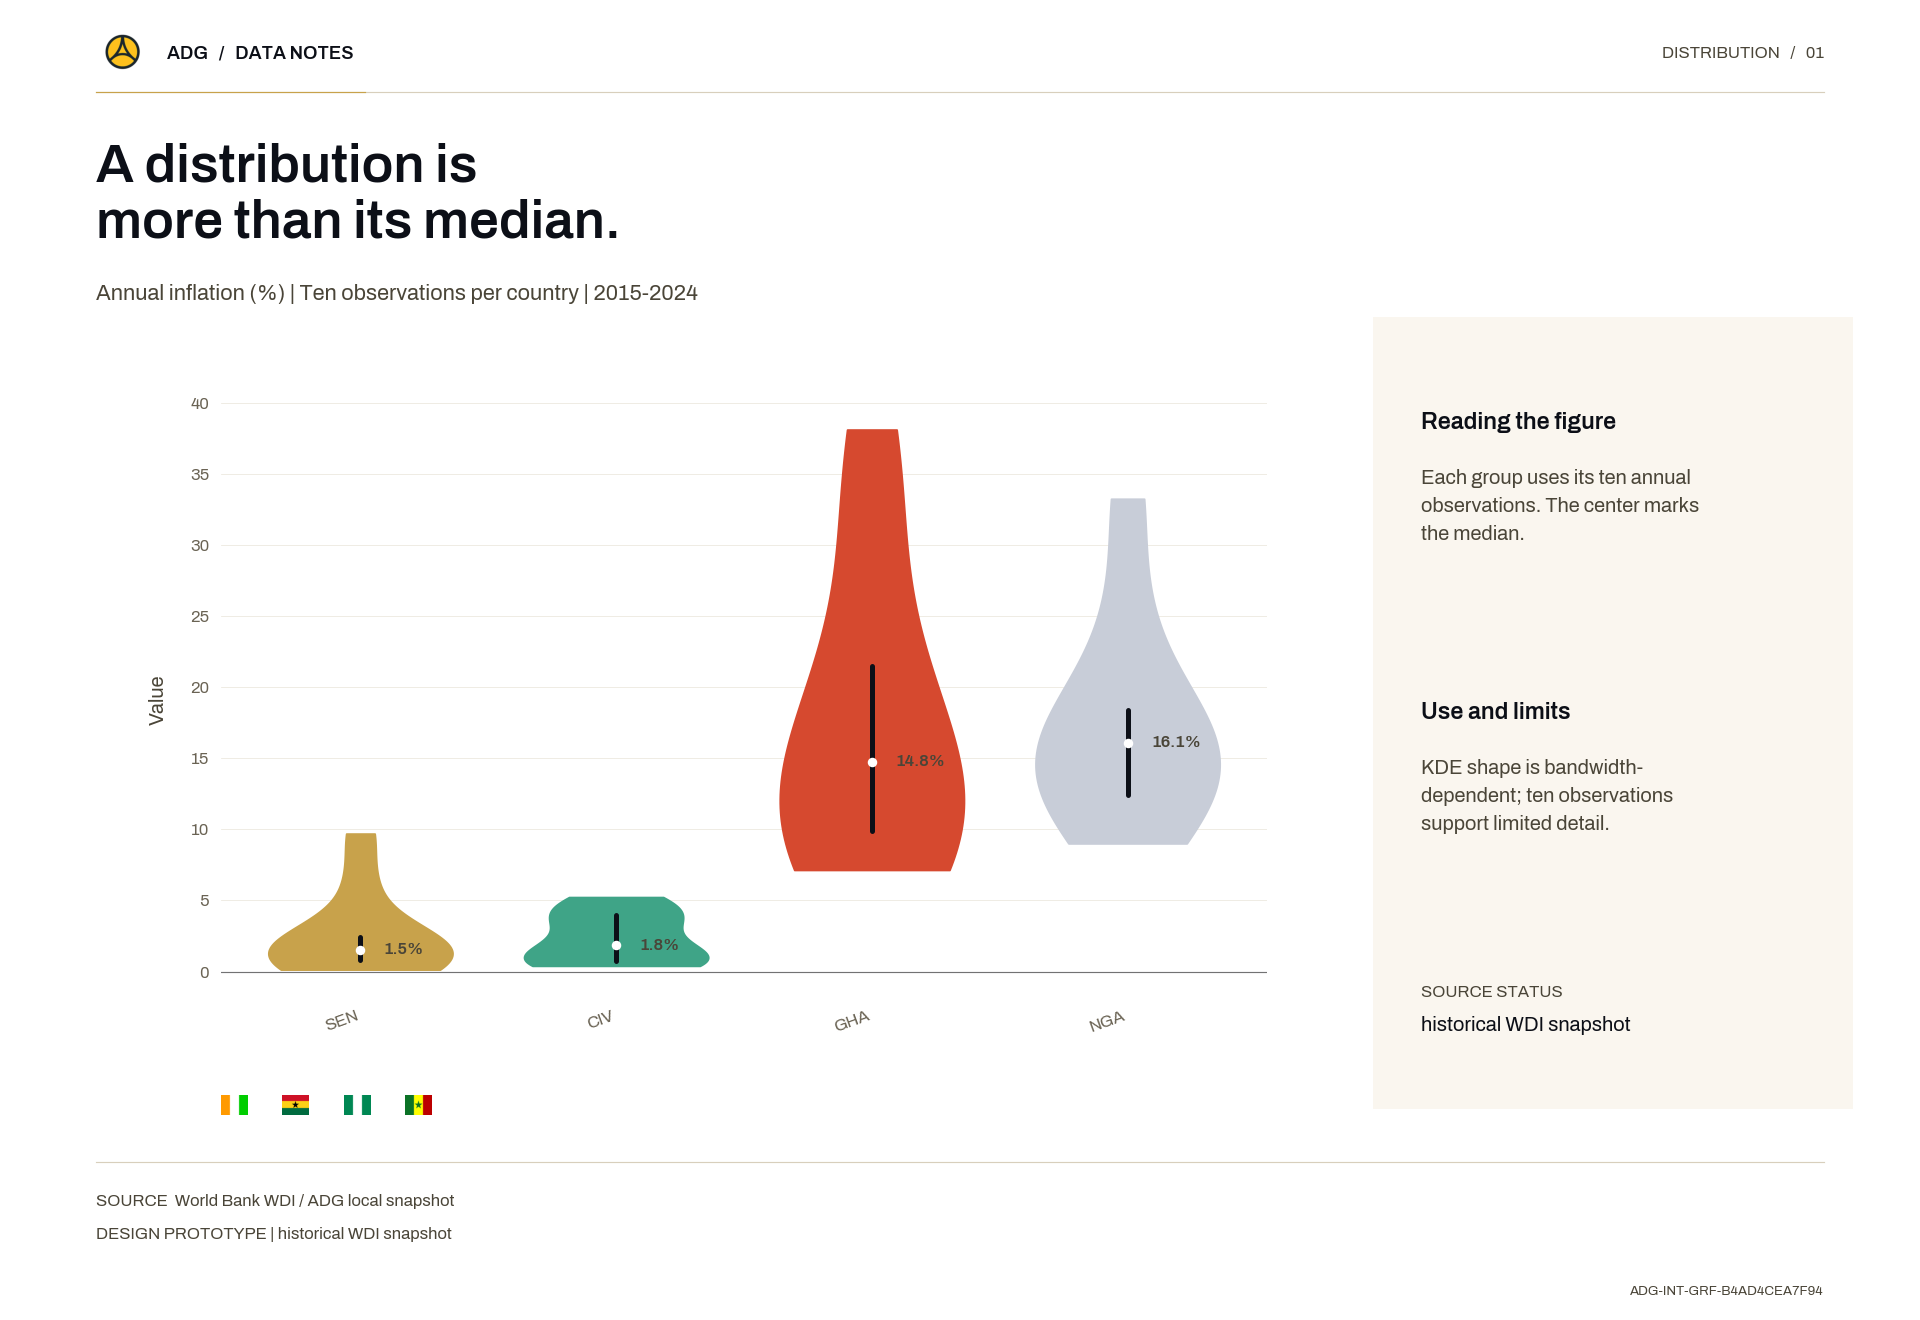
A distribution is more than its median.
Maps Visualization

Une distribution ne se résume pas à sa médiane.

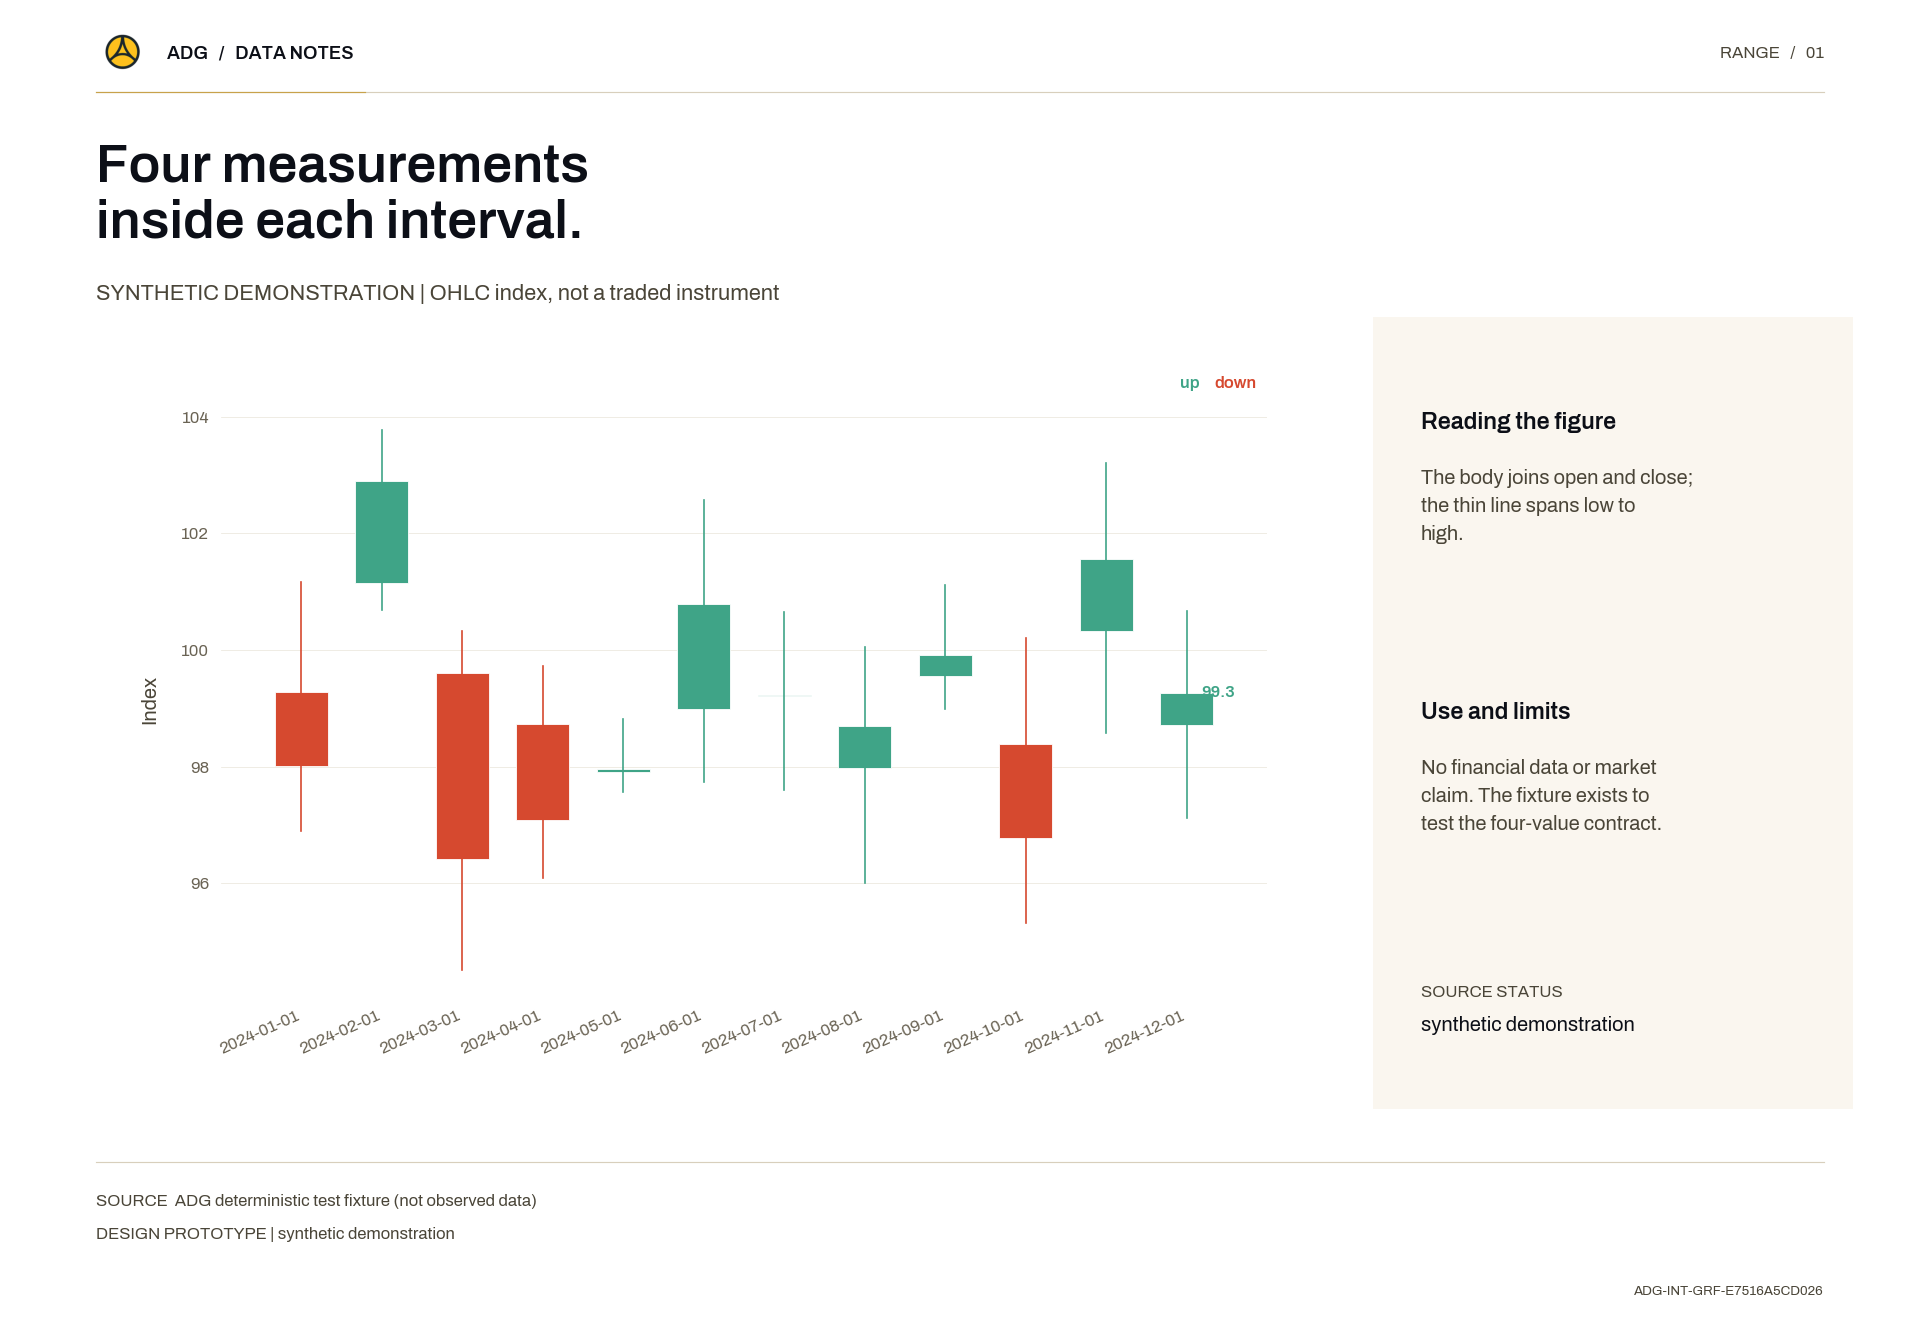
Each group uses its ten annual observations. The center marks the median.Data source: World Bank WDI / ADG local snapshotMethod: KDE shape is bandwidth-dependent; ten observations support limited detail.
Description
Chaque groupe utilise ses dix observations annuelles. Le centre marque la médiane.

Each group uses its ten annual observations. The center marks the median.

Data source: World Bank WDI / ADG local snapshot

Method: KDE shape is bandwidth-dependent; ten observations support limited detail.
Publication Date
Visual Type
Thumbnail / Cover Image
A distribution is more than its median.
Methodology
KDE shape is bandwidth-dependent; ten observations support limited detail.
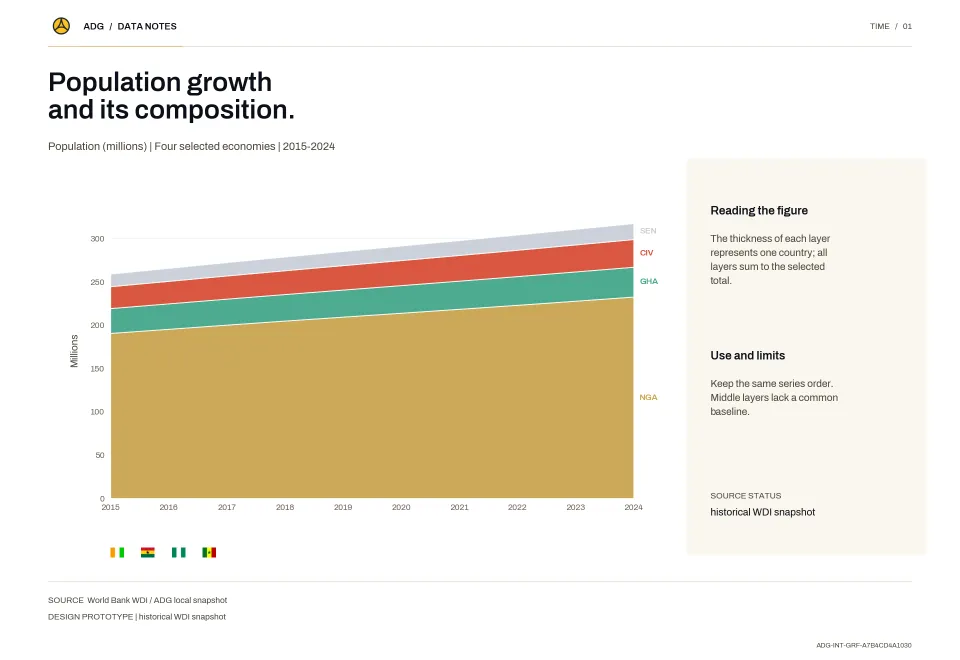
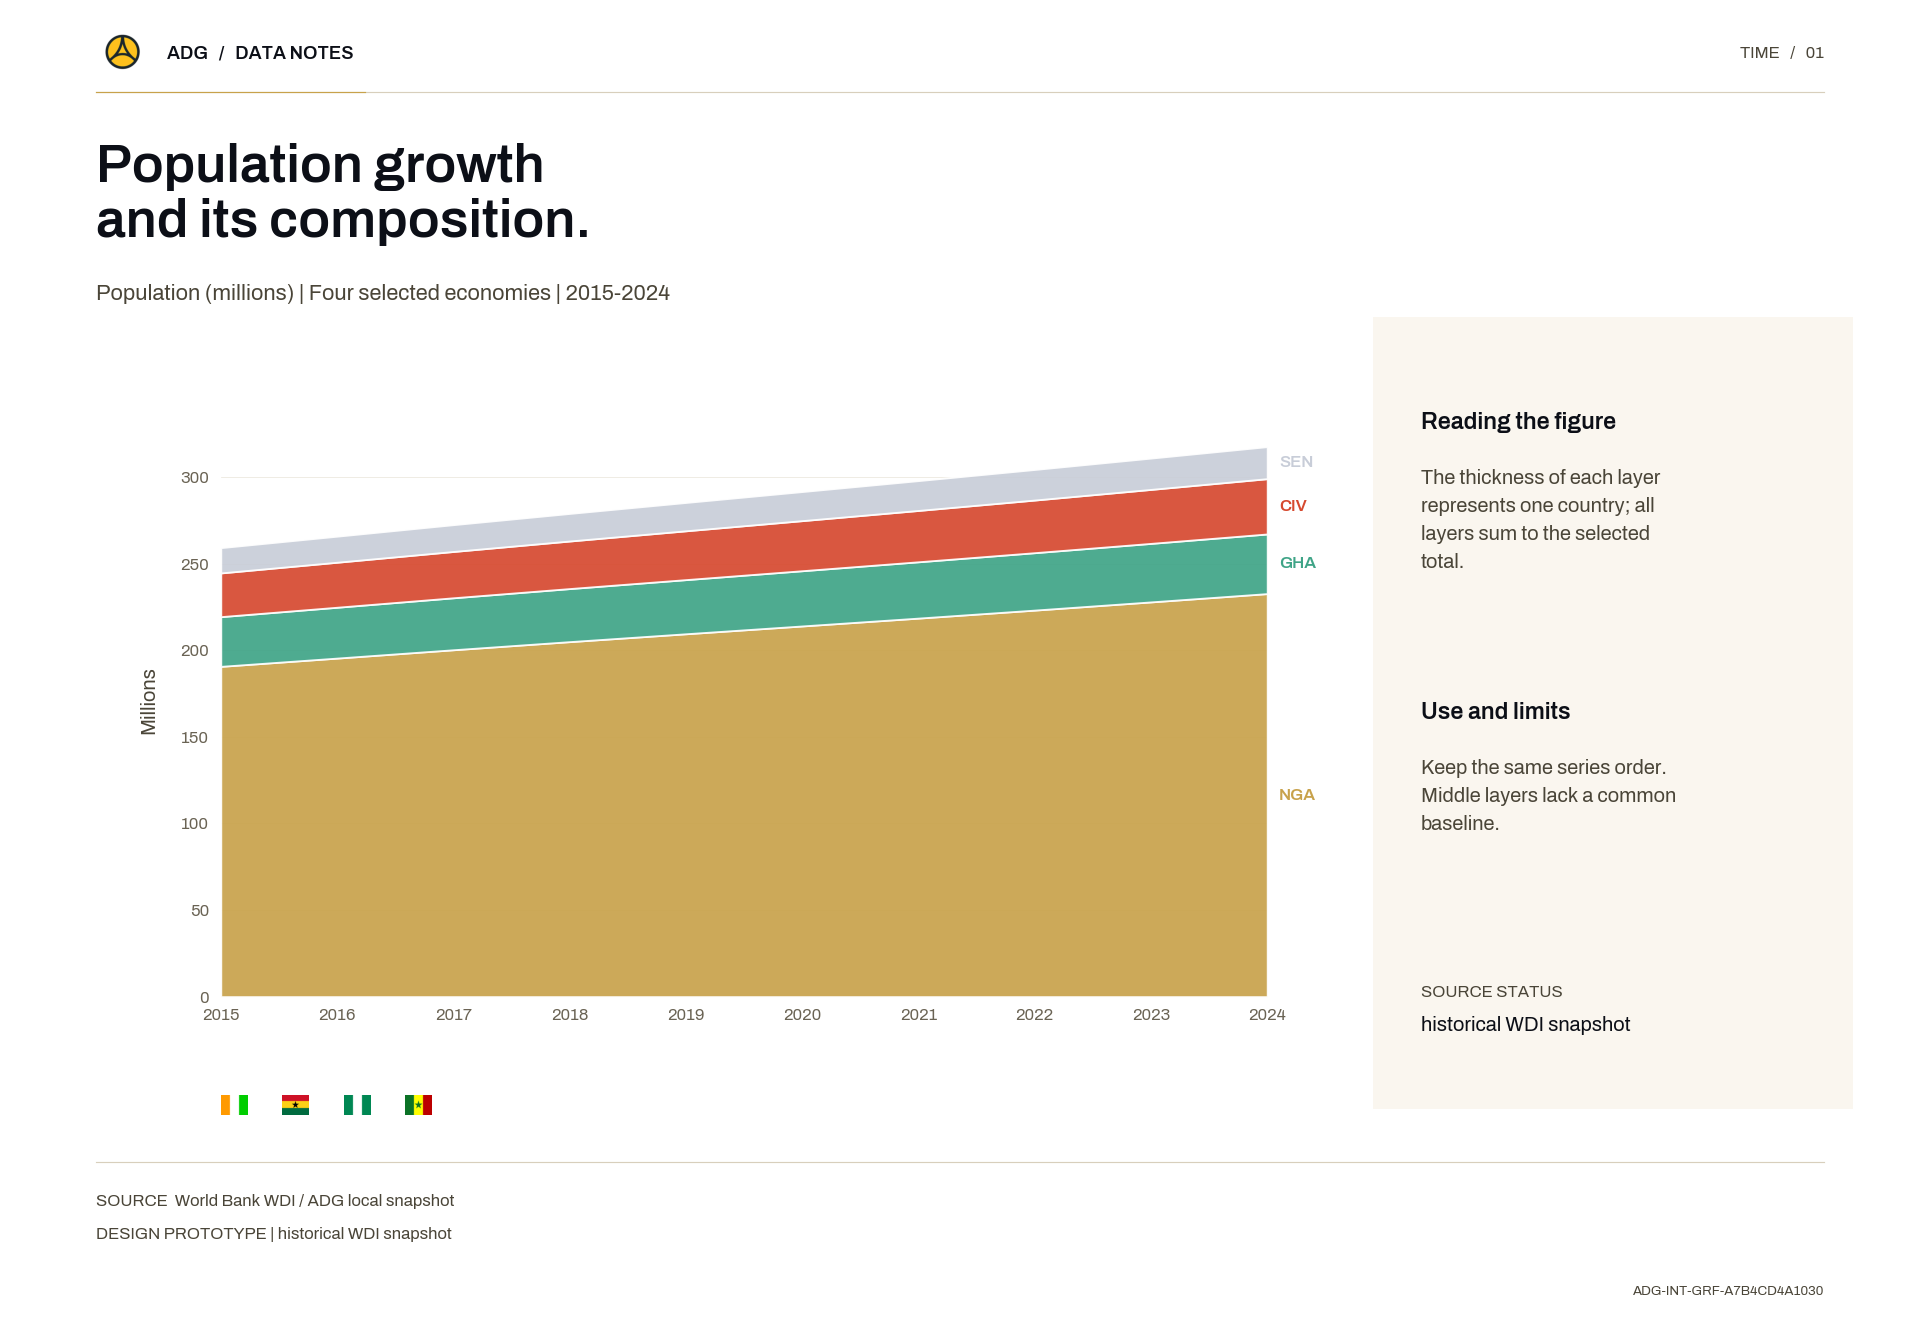
Population growth and its composition.
Maps Visualization

Croissance démographique et composition.

The thickness of each layer represents one country; all layers sum to the selected total.Data source: World Bank WDI / ADG local snapshotMethod: Keep the same series order. Middle layers lack a common baseline.

Description
L'épaisseur de chaque couche représente un pays ; l'ensemble des couches compose le total retenu.

The thickness of each layer represents one country; all layers sum to the selected total.

Data source: World Bank WDI / ADG local snapshot

Method: Keep the same series order. Middle layers lack a common baseline.

Publication Date
Visual Type
Thumbnail / Cover Image
Population growth and its composition.
Methodology
Keep the same series order. Middle layers lack a common baseline.

Aucun résultat trouvé

Essayez d'ajuster votre recherche ou vos filtres.